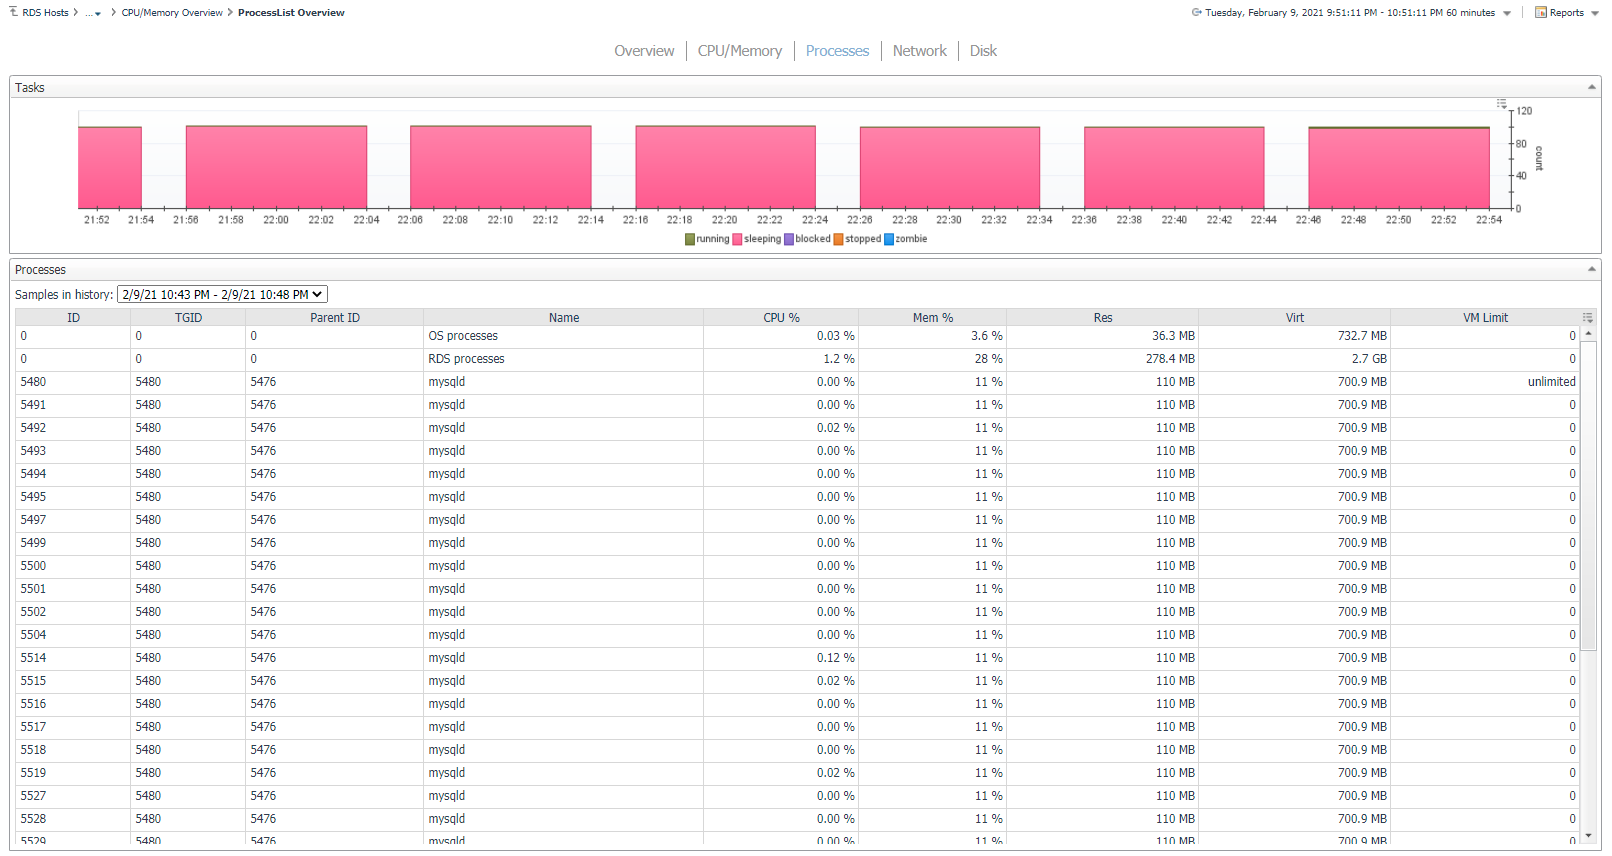
RDS Processes
The Processes page displays a stacked bar chart of task counts organized by state and samples of processes running on the instance. Process data includes identifying information and related CPU, memory, thread usage, and allocations. The Process Samples dashboard shows all samples present in the page’s time range. Samples older than a particular time may be purged or combined depending on the configured retention policy. This page is only available if enhanced monitoring is enabled for the instance. Additionally, data on this page may vary depending on the database type.


