Viewing Query Explorer
The Query Explorer in Foglight is a diagnostic tool that enables database administrators and performance analysts to search, filter, and analyze SQL queries executed within monitored database environments.
It gives you insight and control over SQL query performance so you can maintain a fast, efficient, and healthy database environment.
Available in Foglight 8.0.0. This feature applies only to SQL Server PI and PostgreSQL PI.
The Query Explorer enables you to:
- View detailed information for each SQL statement.
- View historical and real-time SQL queries executed on your database.
- Identify expensive queries in terms of CPU, I/O, wait time, or execution frequency.
- Troubleshoot performance issues.
- Filter query activity by user, application, or client machine.
To access the Query Explorer dashboard, click Query Explorer on the Welcome page, or navigate to Databases > Query Explorer in the left navigation pane.
This section covers the following key areas:
Searching Queries
Query Explorer allows you to search and analyze query performance across SQL Server and PostgreSQL environments. It provides deep insights into query execution, resource consumption, and wait events, enabling you to identify and troubleshoot performance issues efficiently. By filtering queries by domain, instance, text, or resource usage, you can focus on high-impact statements and gain a clear understanding of how queries affect overall system health.
To search a query:
- From the Domain dropdown list, select the required domain (SQL Server or PostgreSQL).
- From the Instance dropdown list, select the required instance.
- Select a search method:
- Search by Query Text: In the SQL text field, enter at least 15 characters of SQL text but not more than 1024 characters.
- Search by Tops: Select the number of top queries to display (for example, Top 10) based on resource usage, such as Workload or Lock. Available options may vary depending on the selected domain.The dropdown displays only the resource categories that were relevant during the selected time range. A resource type (such as CPU, I/O, or Lock) appears in the list only if one or more statements experienced waits or consumed that specific resource within the selected interval.
- Select optional filters:
- Databases - Select the database(s) where the query is executed from the dropdown list.
- Users - Select the user(s) who executed the query.
- Client Machines - Select the originating client machine(s).
- Programs - Select the application(s) or program name(s).
- Click Search to retrieve matching queries.The matching queries are displayed in the lower section of the dashboard. When you select a query from the list, detailed performance metrics appear in the Statement Details pane on the right side of the dashboard.
The list is always filtered based on the selected time range. Only queries that match the search criteria and were executed within that time frame are displayed.
Click Reset to clear all inputs.
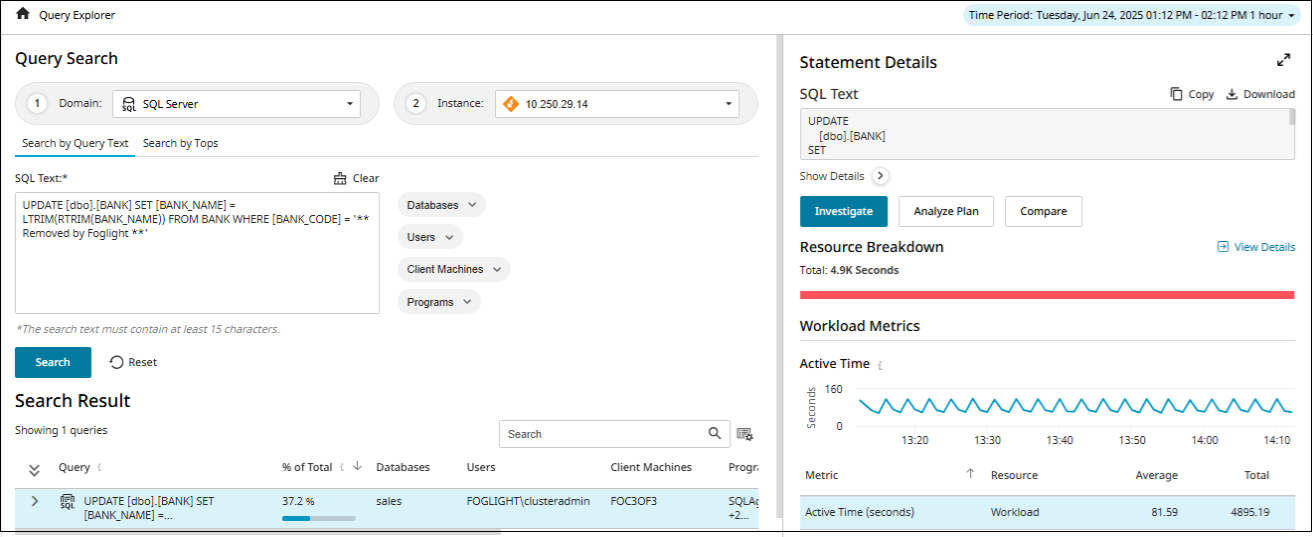
Statement Details
This pane provides details about the performance and resource usage of a specific SQL statement. In the Statement Details pane, use the Expand  and Minimize
  controls to adjust the view. Expanding the pane allows you to see more detailed information about the selected query, while minimizing it helps conserve screen space when viewing multiple queries.
Once a query is selected, the Statement Details pane displays:
- SQL Text - Displays the actual SQL code executed. You can Copy or Download the SQL text. To view more details about the query, click:
- Investigate for detailed analysis view for the query.
- Analyze Plan to generate and review the execution plan for the SQL statement. This feature is available for SQL Server only.
- Compare to compare the current SQL statement or its execution plan with another version. This feature is available for SQL Server only.
- Resource Breakdown - A visual bar chart that shows how the total execution time is distributed across different resource types (for example, CPU, Memory, I/O, and Waits). This helps identify what kind of resource the query is consuming most.
- Workload Metrics - This section displays details such as active time and executions, summarizing key workload performance indicators.
- Active Time - Displays the sum of all active waits and cpu usage, equal to the session total activity within the current interval.
- Executions - Displays the number of times statements were executed that were active during the current interval.
To view the detailed information about the statement, click the expand icon.
This displays a screen with following details:
Highlights - Summarizes key information about the query’s behavior and suggests possible next steps for further analysis. You can click Investigate, Analyze Plan or Compare to view further details as mentioned in the section above.
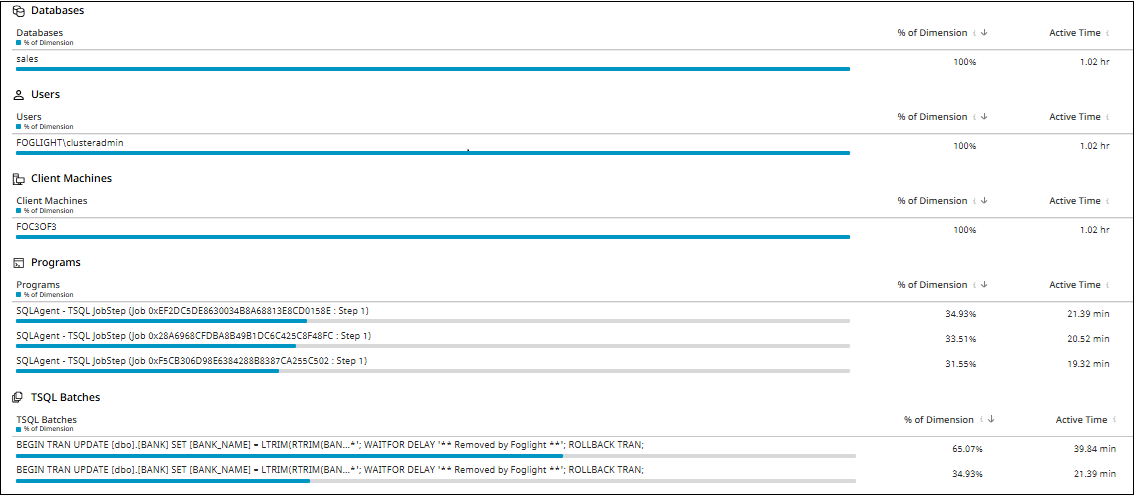
Dimensions by Impact - Summarizes statement activity across key dimensions that helps you to identify which dimensions were involved in query execution. It also enables you to compare performance across different items within the same dimension, such as databases, users, or applications. The dimensions involved are -
- Databases - Lists the name(s) of the databases where the SQL statement was executed.
- Users - Indicates the authenticated user that executed the SQL statement.
- Client Machines - Indicates where the SQL statement originated. This tracks the physical or virtual machine issuing the query.
- Programs - Identifies the source program or process executing the query.
- TSQL Batches - Displays a truncated preview of the actual T-SQL command or script that executed the statement. This is relevant only for SQL Server.
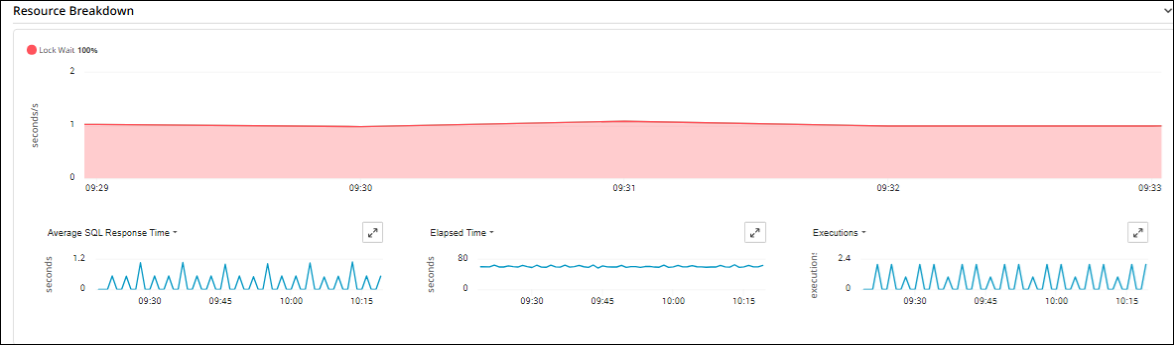
Resource Breakdown - Provides a visual analysis of how different system resources are being utilized during SQL query execution. It shows how the total execution time is distributed across different resource types (for example, CPU, Memory, I/O, and Waits). This helps identify what kind of resource the query is consuming most. You can also view additional metrics related to statement activity by selecting them from the dropdown lists.
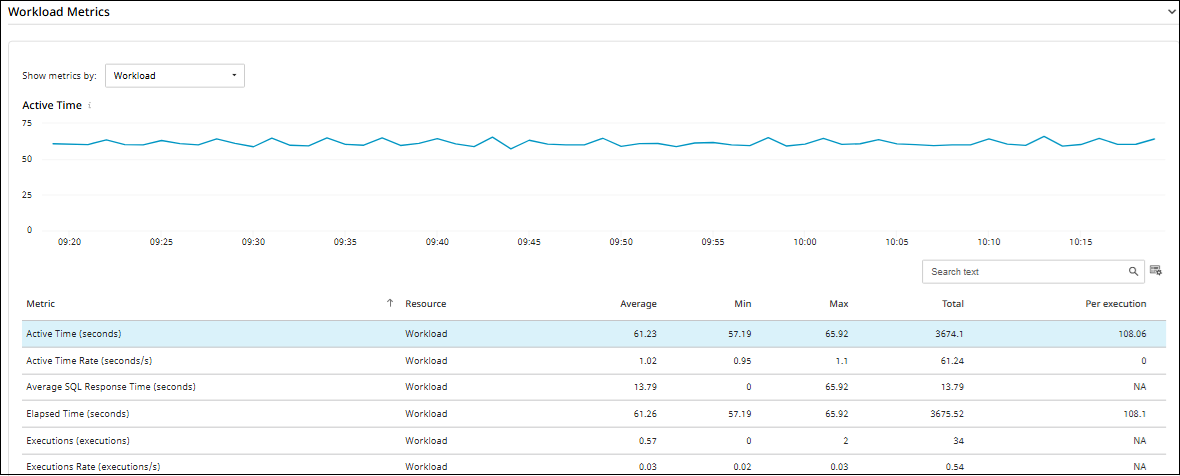
Workload Metrics - Provides a detailed breakdown of how SQL queries are performing over time, focusing on execution and timing metrics. It displays a table for various resource consumption metrics, providing an in-depth view of query activity. Each metric is associated with a specific resource. Use the dropdown list to display metrics related to the resource that had the most impact on query performance, or select All to view all available metrics.
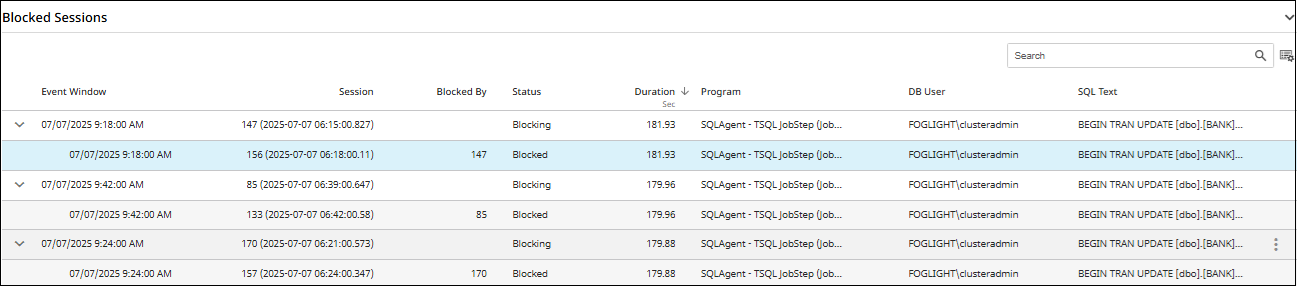
Blocked Sessions - Provides a detailed view of SQL sessions that were blocked during execution. This information is essential for diagnosing performance issues related to locking and blocking in the database. The view displays the top X blocking events that occurred within the selected time range, ordered by lock duration in descending order.
Accessing Query Explorer from an External Link
You can open the Query Explorer page in Foglight directly from another monitoring application using a formatted URL:
<Base URL>?<Search Details>
where:
- Base URL: https://<your-environment-host>/aui/foglight-sql-profiler/query-explorer-direct-link
- Search Details:
- domain (mandatory) - Database type (for example, SQL_SERVER or PostgreSQL).
- queryText (mandatory) - The SQL query text (must be URL encoded). It should contain at least 15 characters but no more than 1024 characters.
- hostName (mandatory) - Hostname or IP address of the database server. It should be a host that is already monitored by Foglight.
- startTime (optional) - Start time in epoch milliseconds (UTC). Default is the current time - 1 hour.
- endTime (optional) - End time in epoch milliseconds (UTC). Default is the current time.
- filters (optional) - List of dimension and dimension values separated by@.
filter1 name,<filter value1, ..,filter valuen>@ filter2 name,<filter value1,..,filter valuen>.
Possible filter names are - Database, Users, Client Machines, or Programs. - instanceName (optional) - Instance name of the DB server.
- instancePort (optional) - Port number of the instance.
By adding the above mentioned details, a URL can be created to access Query Explorer. For example:
https://<your-environment-host> /aui/foglight-sql-profiler/query-explorer-direct-link?hostName=10.250.29.14&startTime=1750729861000&endTime=1750744261000&domain=SQL Server&filters=Databases,sales,@Users,FOGLIGHTclusteradmin@Programs,SQLAgent-JobManager,master&queryText=SELECT t.relid as relid
If there is an error in any of the parameters mentioned above, then an error message appears on the screen.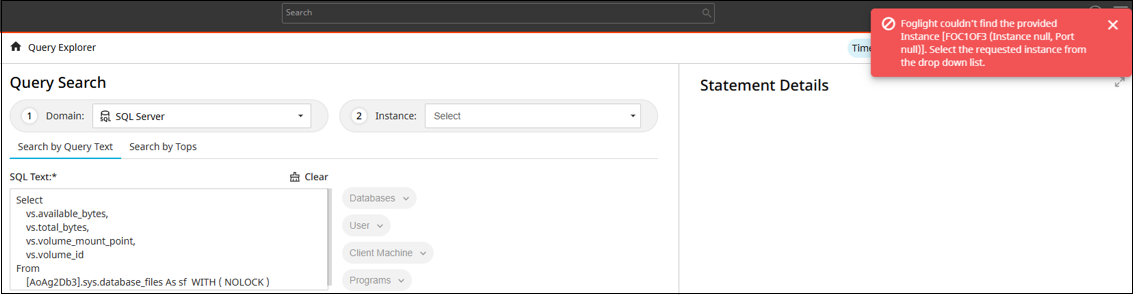
After entering a valid URL, log in to Foglight if prompted. After authentication, the Query Explorer page opens with the specified SQL text preloaded (if found).
Use filters within Query Explorer to refine the query context as needed.