Warehouses
The Warehouses dashboard displays all warehouses in the account, including configuration details, active query counts, status, resource availability, and credit usage. Select a warehouse in the table to view its details.
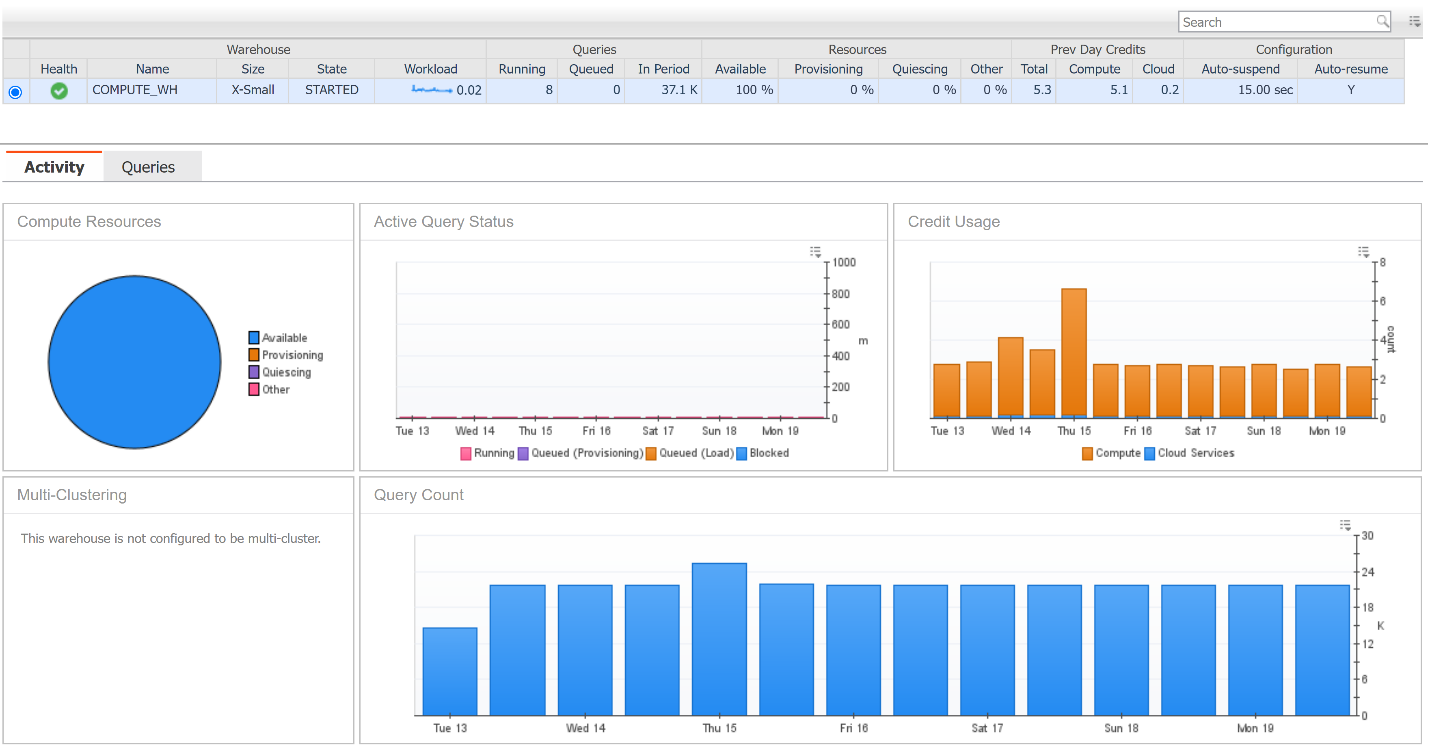
The Activity tab provides graphs that show historical warehouse activity, including average queries by state, total credit usage, and the total number of queries run. If the warehouse is active, a pie chart displays compute resource allocation. If multi-clustering is enabled, the number of started instances also appears.
The Queries tab contains a table that groups queries by type (for example, SELECT, INSERT) and displays outcomes (successful, failed, incident), elapsed time, queuing time, query load percentage, and credit usage for the selected time range. Selecting a query type updates a visual breakdown of detailed metrics for that query type.