Queries
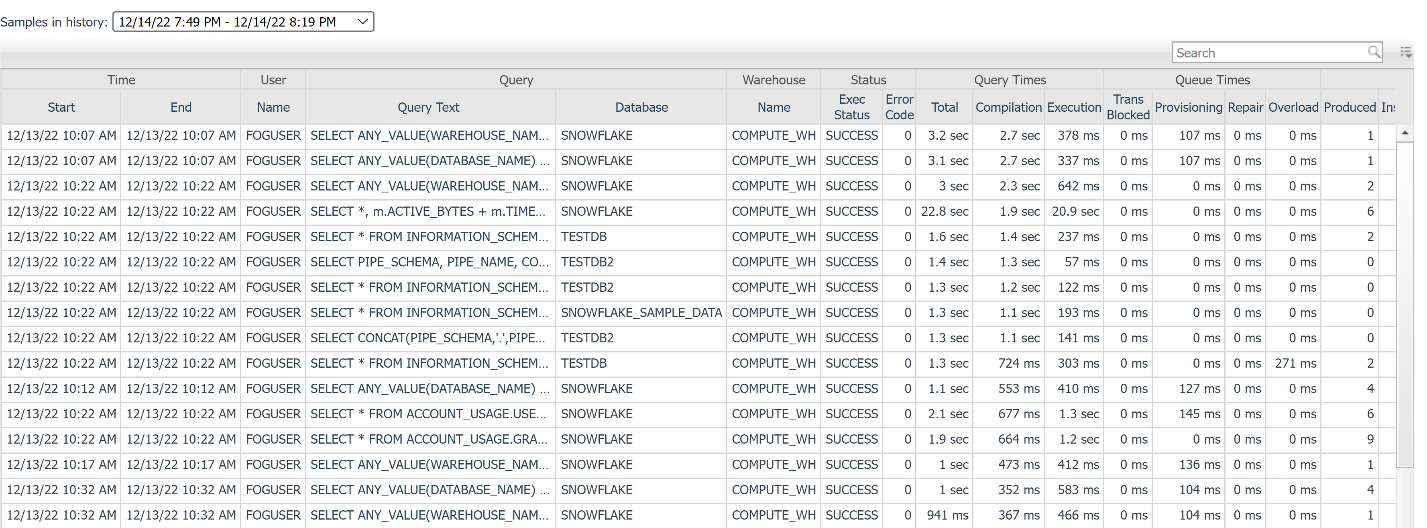
The Queries page lists the top x queries for each sample period, based on the configuration defined in the agent properties. Each row provides data related to a query, including its text. You can view the full query text by selecting or hovering over the abbreviated version.
Displayed data includes execution time, user, role, session, database, warehouse, queue and execution timings, result status, and credit usage. Some columns are hidden by default but can be shown using the table customizer in the upper-right corner.
The Samples in history dropdown indicates the sample period represented by the queries in the table. To view a different sample period, select another option from the dropdown. Only sample periods within the dashboard’s time range are shown. Adjusting the time range updates the list of available sample periods.
Click the Query Text column to open a table popup that lists all matching queries executed during a two-week time frame.
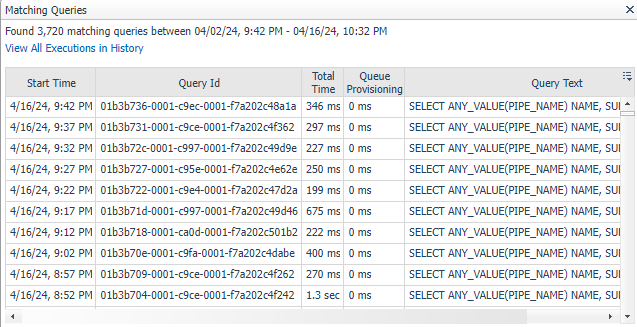
Click View All Executions in History to view all matching executions along with detailed information.