Performance Dashboards
The Snowflake Performance module includes various dashboards.
This section covers the following key areas:
Snowflake Accounts
The Snowflake Accounts dashboard provides a high-level overview of all monitored accounts. For each account, it displays information about availability, workload, health, alarms, daily credit usage, object counts, and storage size by type.
To view more details for a specific account, select the account name to open its Overview page. You can also select or hover over many column values to view additional data.

Overview
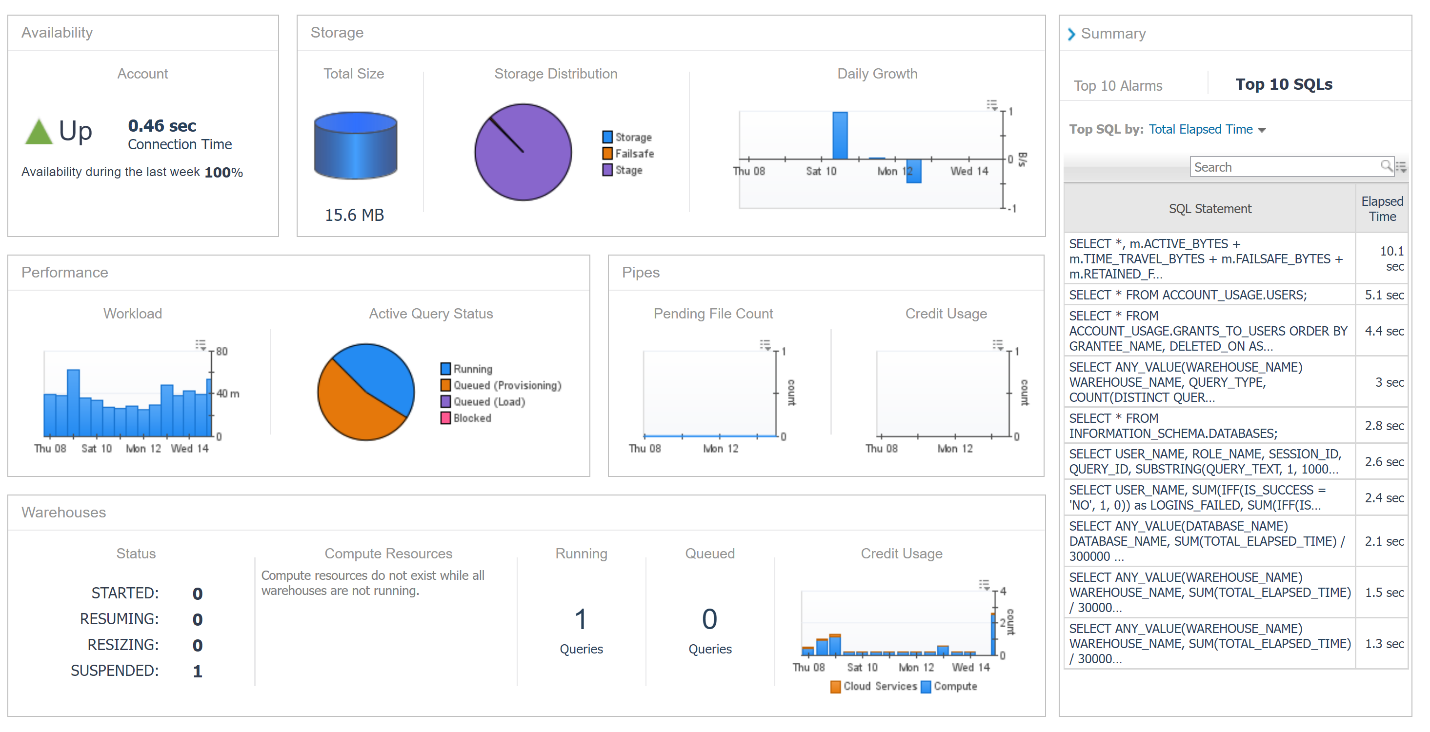
The Overview page provides a summary of key segments for a Snowflake account. It displays information on availability, storage distribution and growth, performance, pipe activity and queuing, warehouse status, resources, and credit usage.
An expandable summary box highlights the top 10 active alarms by severity and the top 10 collected queries for the account.
Warehouses
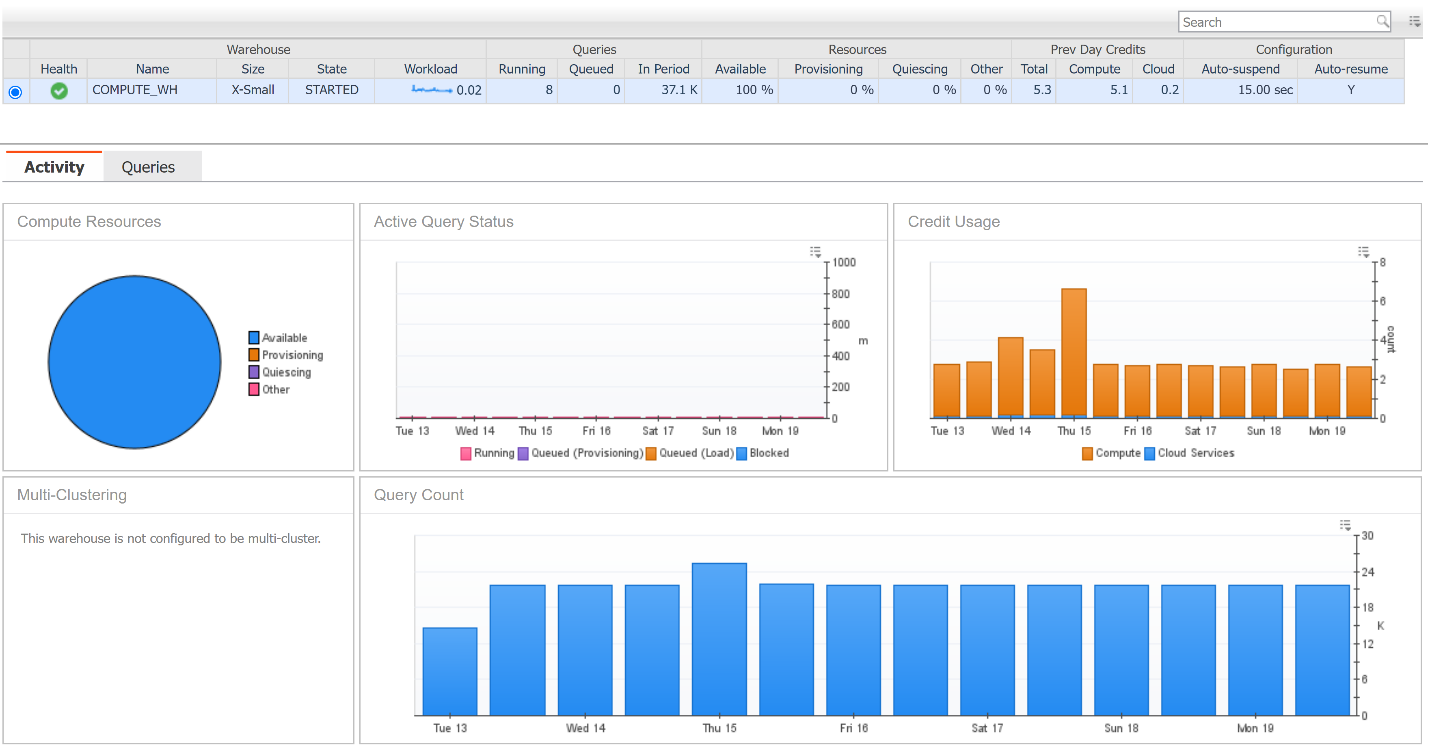
The Warehouses dashboard displays all warehouses in the account, including configuration details, active query counts, status, resource availability, and credit usage. Select a warehouse in the table to view its details.
The Activity tab provides graphs that show historical warehouse activity, including average queries by state, total credit usage, and the total number of queries run. If the warehouse is active, a pie chart displays compute resource allocation. If multi-clustering is enabled, the number of started instances also appears.
The Queries tab contains a table that groups queries by type (for example, SELECT, INSERT) and displays outcomes (successful, failed, incident), elapsed time, queuing time, query load percentage, and credit usage for the selected time range. Selecting a query type updates a visual breakdown of detailed metrics for that query type.
Queries
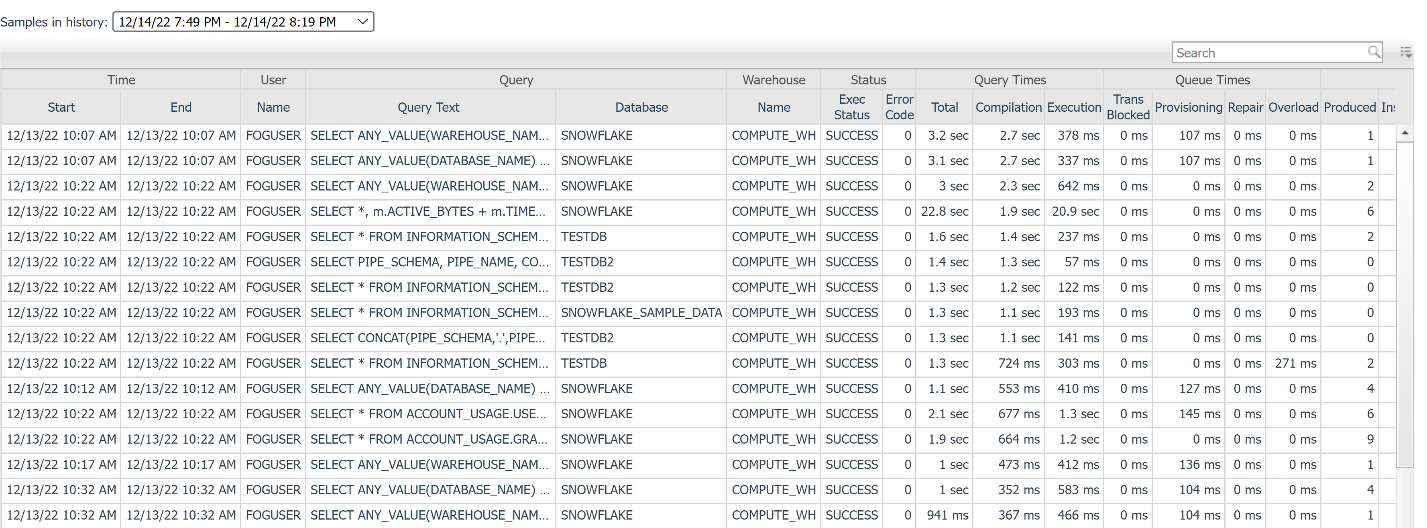
The Queries page lists the top x queries for each sample period, based on the configuration defined in the agent properties. Each row provides data related to a query, including its text. You can view the full query text by selecting or hovering over the abbreviated version.
Displayed data includes execution time, user, role, session, database, warehouse, queue and execution timings, result status, and credit usage. Some columns are hidden by default but can be shown using the table customizer in the upper-right corner.
The Samples in history dropdown indicates the sample period represented by the queries in the table. To view a different sample period, select another option from the dropdown. Only sample periods within the dashboard’s time range are shown. Adjusting the time range updates the list of available sample periods.
Click the Query Text column to open a table popup that lists all matching queries executed during a two-week time frame.
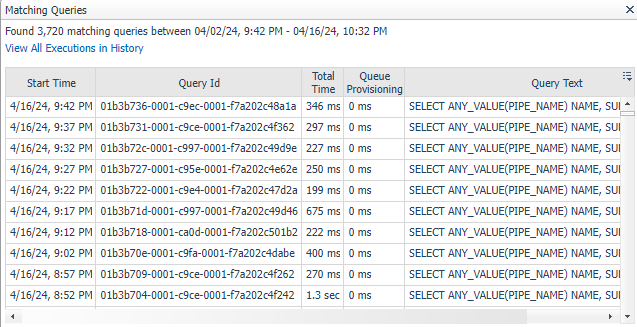
Click View All Executions in History to view all matching executions along with detailed information.
Storage
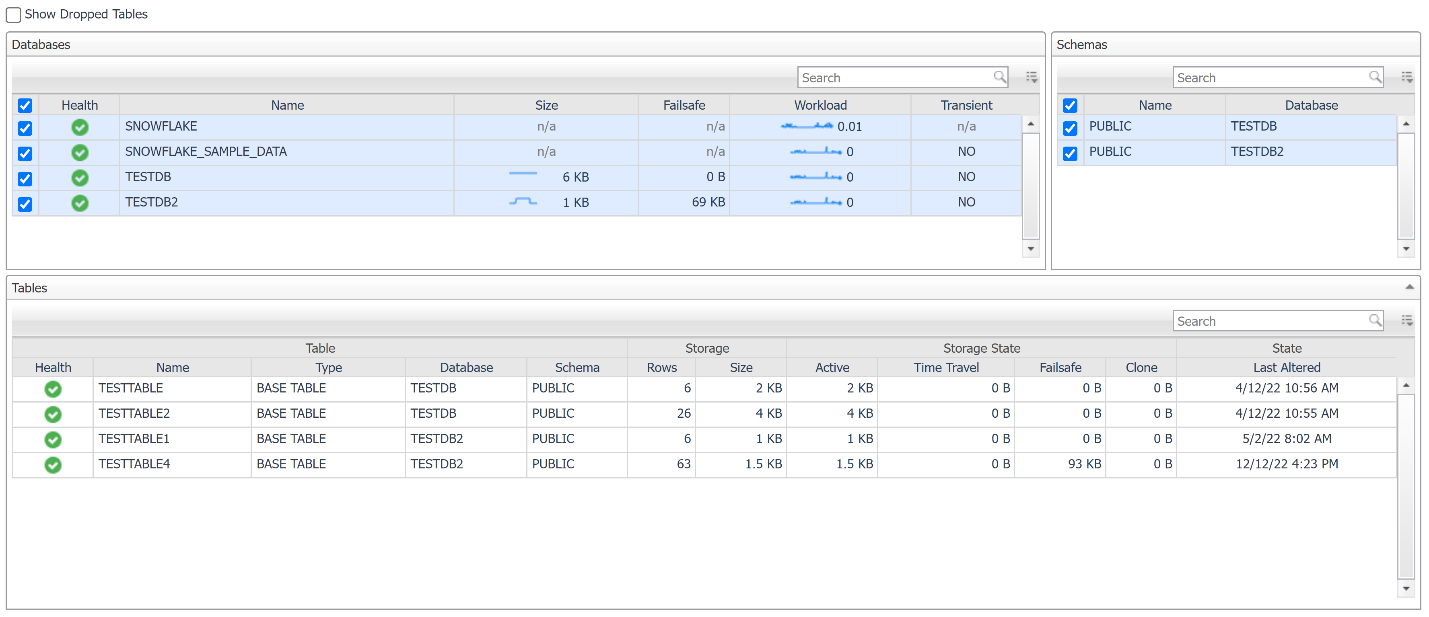
The Storage page displays information about the databases, schemas, and tables in the Snowflake account. The number of tables shown and the criteria for inclusion are defined in the Top Tables section of the agent properties. Tables from databases listed in the DB Overrides section are excluded.
The Databases table lists all databases, including storage usage (space and failsafe), workload metrics, and configuration details. Clearing a database row hides its schemas and tables from the other tables on the page.
The Schemas table lists all schemas within the selected databases along with their configuration details. Clearing a schema hides its associated tables from the Tables table.
The Tables table displays configuration details, storage usage (by row count and size), storage state usage, table state, and clustering information (if applicable). To view dropped tables, select the Show Dropped Tables checkbox. Snowflake continues to charge for dropped tables as long as their data remains in active, time travel, or failsafe storage.
For all tables, some columns are hidden by default but can be shown using the table customizer in the upper-right corner. Select or hover over a metric to view a pop-up chart showing the historical trend of that metric within the selected time range.
Pipes
The Pipes page displays all pipes in the account. Pipes facilitate data ingestion into Snowflake from external sources. Each row includes identifying information, configuration details, and pipe activity for the selected time range, including total credit usage, data inserted, and files inserted. The table also shows the current state of each pipe and any associated errors.

Users
The Users page displays all users in the Snowflake account, along with identifying information, current account status, and configuration details.
The Login columns show the time of the last successful login and the number of successful and failed login attempts within the selected time range. A high number of failed login attempts may indicate a password misconfiguration in an application or potential unauthorized access attempts.
To monitor failed logins, use the Snowflake User Failed Logins rule. You can customize this rule to change the threshold for failed attempts before an alarm is triggered.
When you select a user, the table displays all roles assigned to that user, including details about who granted the roles and when they were created or deleted. To display deleted users and roles, select the corresponding checkboxes at the top of the page.

Blocked TRX
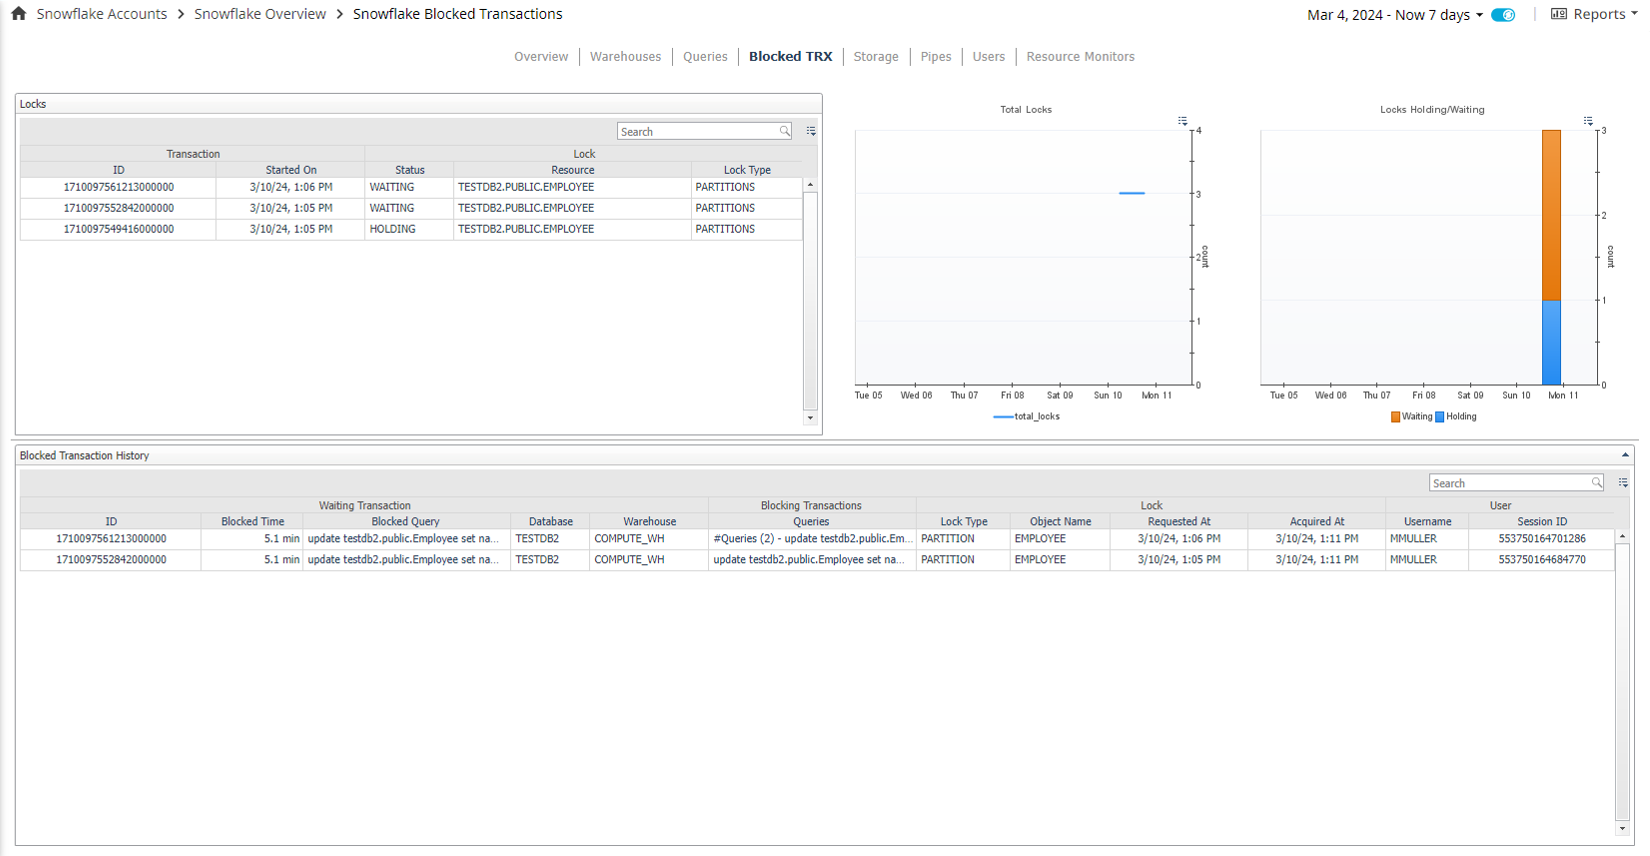
The Blocked TRX page displays the resource locks and blocked transaction history information for the selected Snowflake account. To address table latency, the data is divided into two separate collections and tables:
- Locks
- Blocked Transaction History
Locks: Displays the locks collected in the selected time frame. There is no latency for this collection.
- ID: The transaction identifier.
- Started On: The time at which the lock on a resource began.
- Status: The current status of the lock at the time the data was collected.
- Resource: The resource which is being locked.
- Lock type: The type of lock on the resource.
Blocked Transaction History: Displays historical data about blocked transactions. There is a potential latency of up to three hours.
- ID: The transaction identifier.
- Blocked Time: The total time the transaction was blocked.
- Blocked Query: The query text of the blocked transaction.
- Database: Identifier of the database containing the object for which the transaction is waiting for a lock.
- Warehouse: The warehouse in which the transaction is waiting for a lock.
- Blocking Transactions Queries: List of queries that were blocking the waiting transaction.
- Lock type: The type of lock on the resource.
- Object Name: Identifier of the object for which the transaction is waiting to acquire a lock.
- Requested At: Timestamp indicating when the transaction waiting for the lock made the request.
- Acquired At: Timestamp indicating when the lock was acquired by the transaction currently holding it.
- Username: The user who issued the transaction.
- Session ID: Session that executed the statement.
Actions
Click the Blocking Transactions Queries column to view a table that displays all transactions that are blocking the waiting transaction.
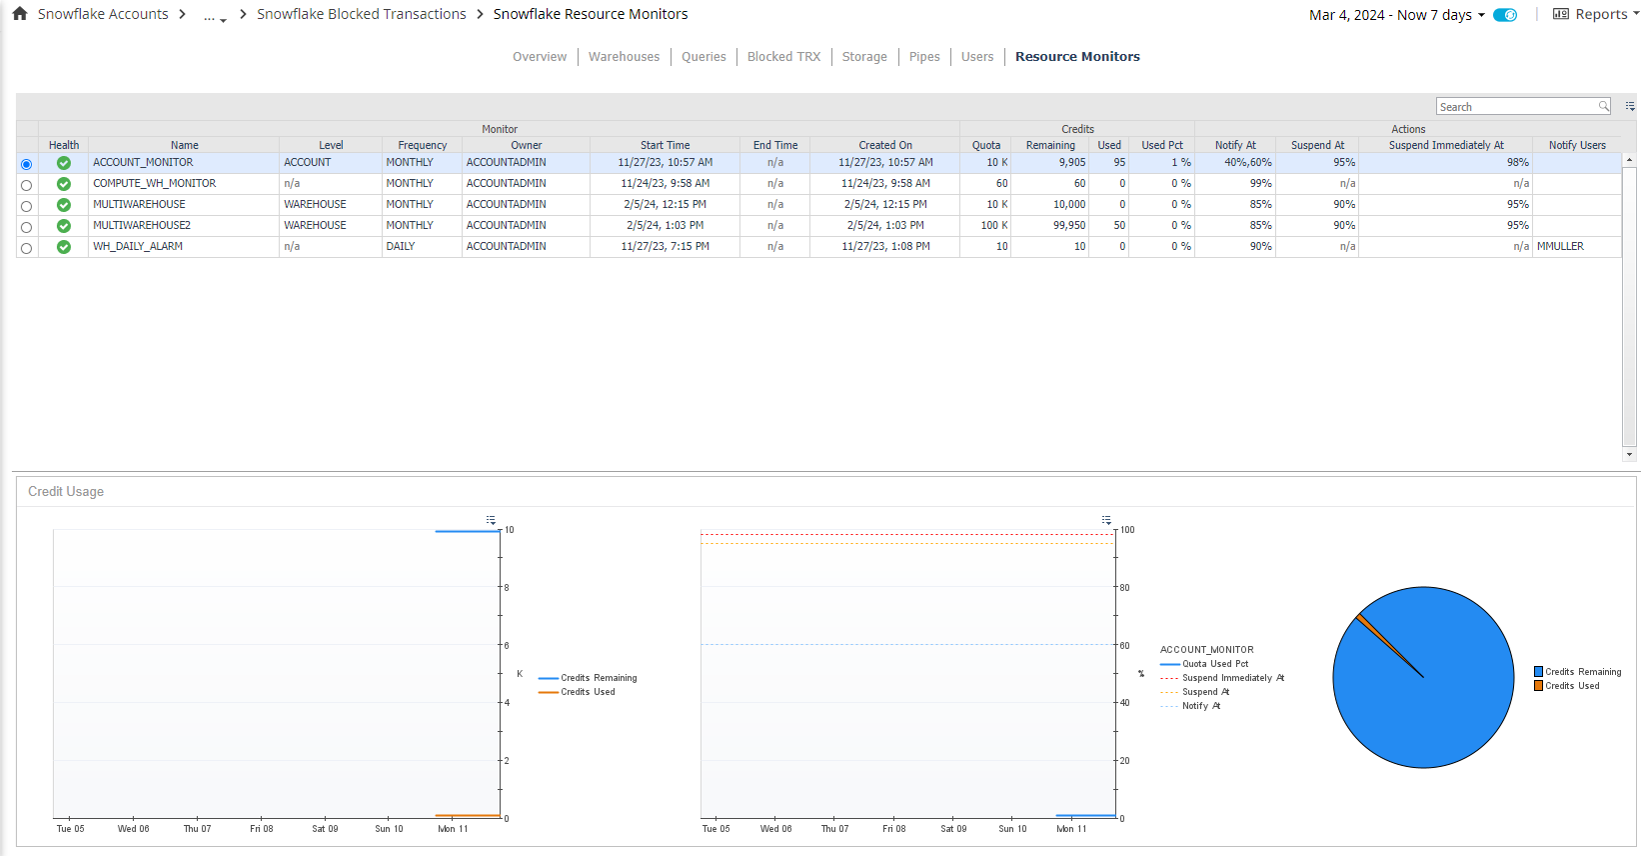
Resource Monitors
The Resource Monitors page displays table of all resource monitors for the Snowflake Account with the following columns:
- Health: Displays the current health status of the resource monitor.
- Name: The resource monitor name.
- Level: The level at which the resource monitor is configured.
- Frequency: The interval at which the used credits reset in relation to the specified start date.
- Owner: The role that owns the resource monitor.
- Start Time: Date and time when the resource monitor starts monitoring the assigned warehouses.
- End Time: Date and time when Snowflake suspends the warehouses associated with the resource monitor.
- Created On: Date and time when the resource monitor was created.
- Quota: The credit quota assigned to the resource monitor.
- Remaining: The remaining credits.
- Used: The used credits.
- Used Pct: The percentage of used credits.
- Notify At: The credit usage percent at which Snowflake will notify that it has been reached.
- Suspend At: The credit usage percentage at which Snowflake suspends all assigned warehouses after completing all currently executing statements.
- Suspend Immediately At: The credit usage percent at which Snowflake will suspend all assigned warehouses immediately, which cancels any statements being executed by the warehouses at the time.
