Viewing Dashboards
This cartridge includes the following main dashboards:
- SAP HANA Systems
- Host Overview
- Memory
- Host Load
- Services
- SQL Plans
- Expensive Statements
- Blocked Transactions
- Table Persistence
- Native Alerts
SAP HANA Systems
The main entry point to the Foglight for SAP HANA cartridge dashboards. It provides a list containing each SAP HANA system monitored by the Foglight Management Server. Each system can be identified by its SAP ID and its system code. The database hosts that comprise the system are selectable to enable drilling down to the Host Overview page (see below). The dashboard displays system properties, availability, and current alarm state.

Host Overview
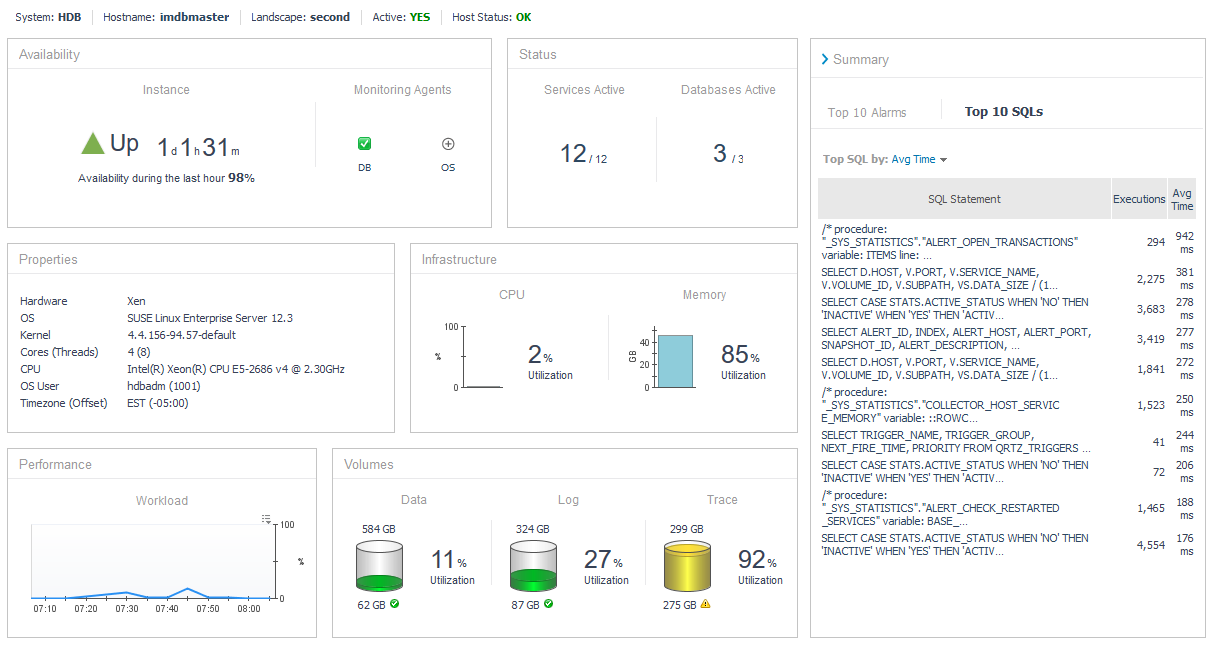
The Host Overview screen provides a comprehensive overview and health status for the selected database host. Availability and monitoring status, as well as database and service up/down status, are displayed along with hardware and software installation properties. Infrastructure and storage utilization, top SQL plans, and top current alarms give a top-level overview of the performance of the database host.
Memory
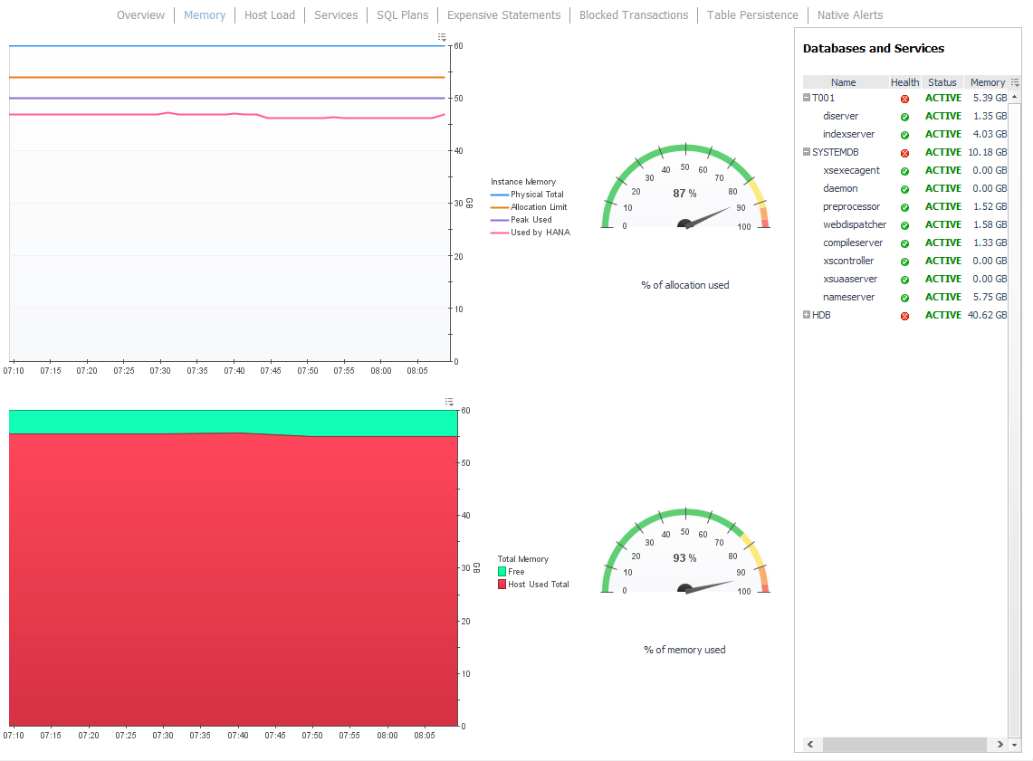
Memory from the host and current Utilization are displayed alongside peak and current memory usage for the SAP HANA database.
Host Load
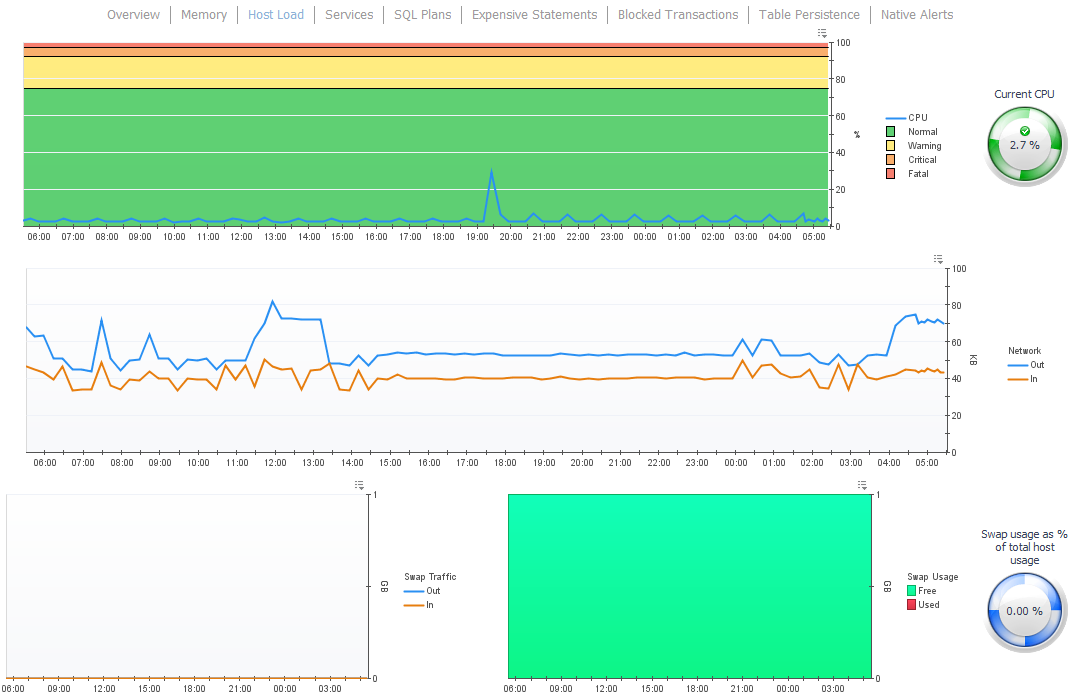
CPU, Network Load, and Swap Usage for the database host are displayed in parallel graphs.
Services
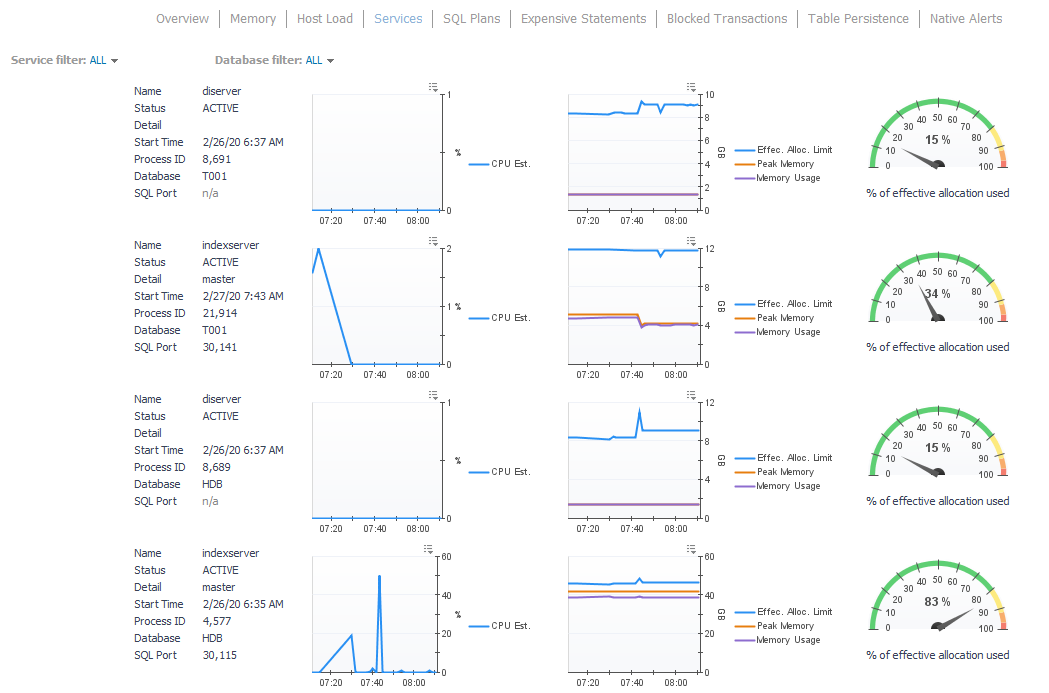
Database service views for both the system database and each monitored tenant database show estimated CPU usage along with the service start time, process ID, and other service properties.
SQL Plans
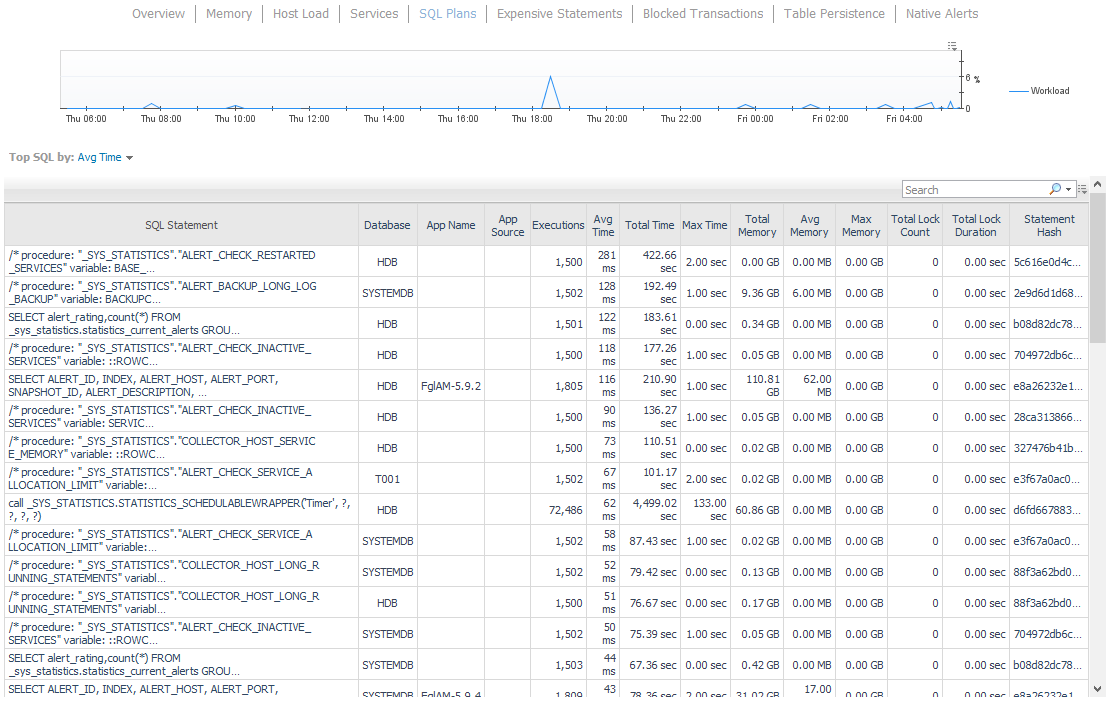
SQL statement, hash, and a variety of performance metrics are tabulated for the collected SQL plans. Top SQL plans are collected and are sorted by criteria defined in the agent properties. Sort criteria include average execution time, total execution time, execution count, average execution memory size.
Expensive Statements
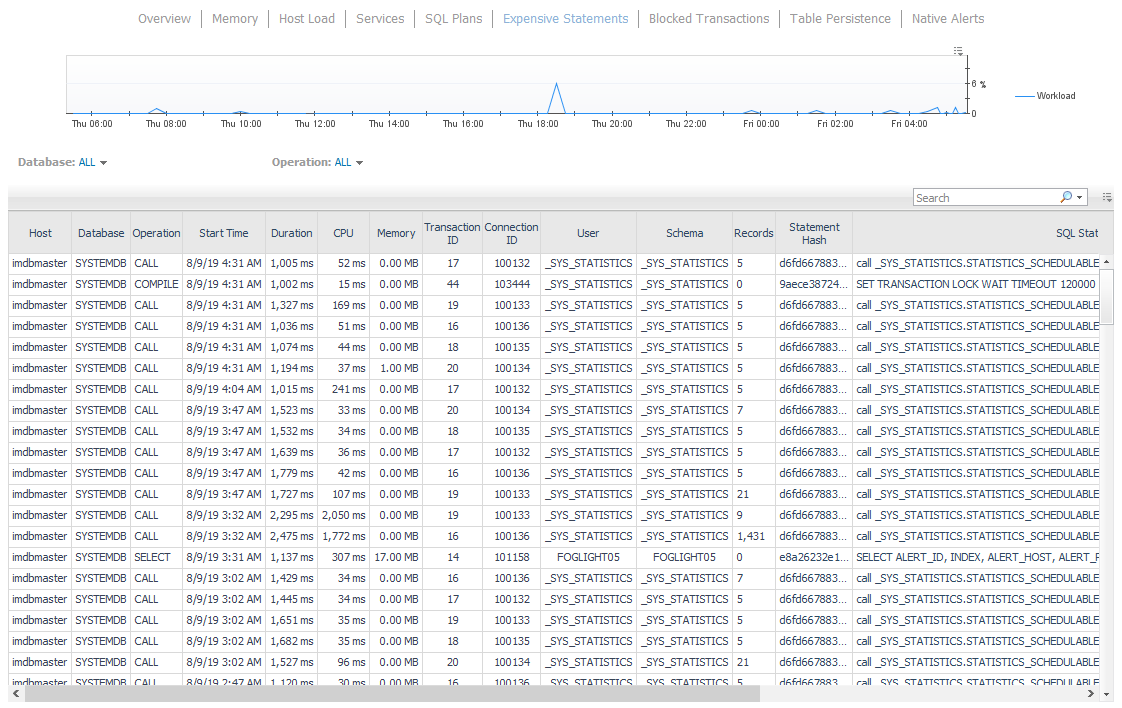
The Expensive Statements dashboard displays individual statement executions that exceed CPU, memory, or time thresholds. Resource monitoring must be configured in the SAP HANA database to enable expensive statement monitoring. See the agent configuration section above.
Blocked Transactions
Blocked transactions metrics are displayed along with the time of occurrence, lock details, lock owner, and blocked transaction hashes.

Table Persistence
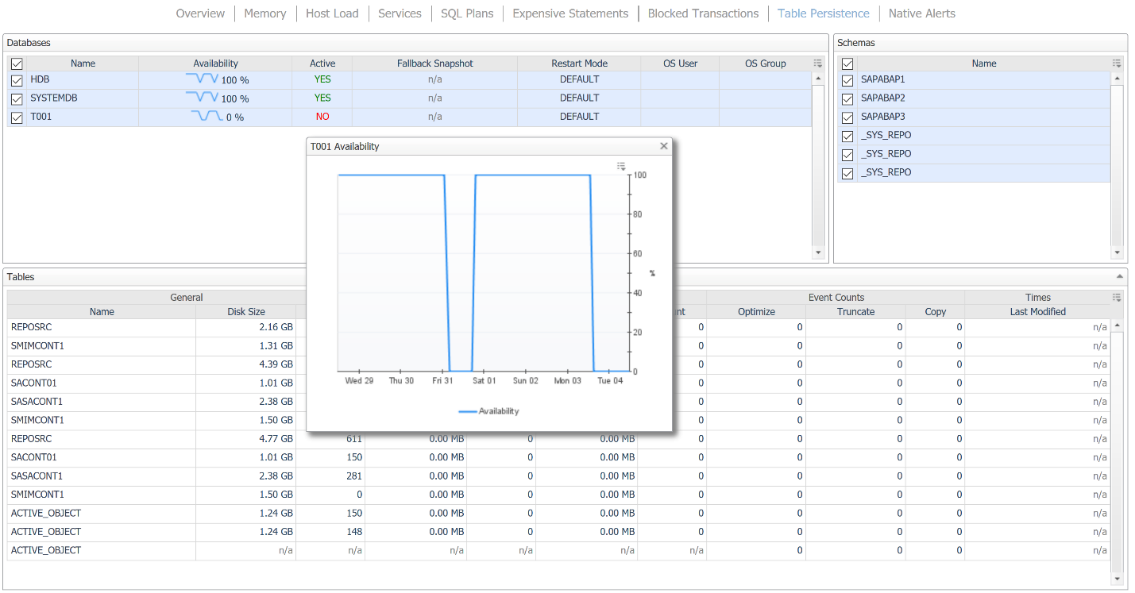
Metrics related to the largest tables are displayed. The Table Persistence dashboard shows availability charts for the system database and each monitored tenant database. Tables can be filtered by database and schema. The minimum size threshold for tables as well as a maximum total number of tables to collect is configurable in the agent properties.
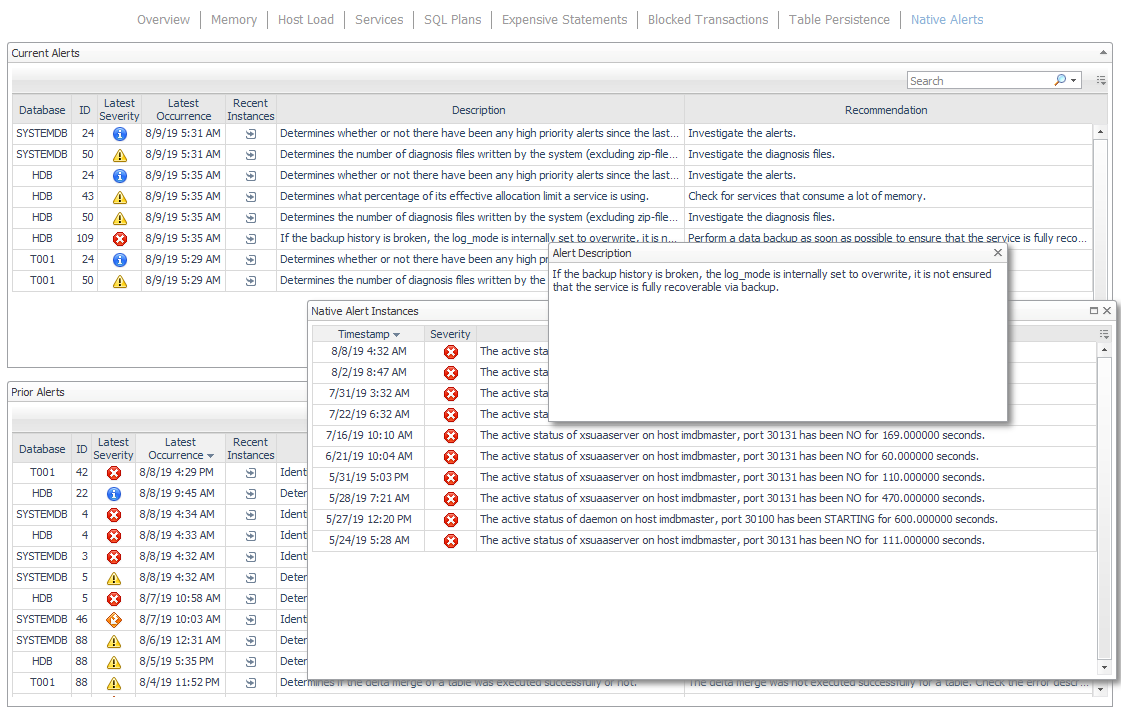
Native Alerts
Native SAP HANA database alerts are collected by the SAP HANA agent. Each alert is then assigned a Foglight severity (informational, warning, critical, or fatal) corresponding to their alert severity. These alerts can be seen on the main Foglight alarms dashboard along with alarms generated by all other cartridges.
