Enterprise Logs
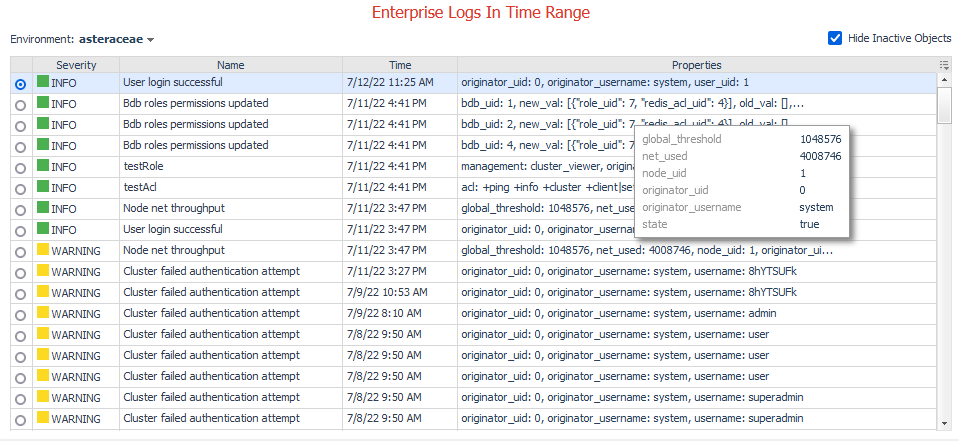
The Enterprise Logs dashboard displays the latest cluster-wide log entries within the current time range. Use the Enterprise Cluster selector in the top left to switch between log entries for different environments.
The dashboard always displays log entries from the current time range. Click or hover over an entry in the Properties column to view a popup table showing all property key-value pairs.
The Hide Inactive Objects checkbox determines whether environments without data in the current time range are displayed in the Environment selector.


