Redis Environments
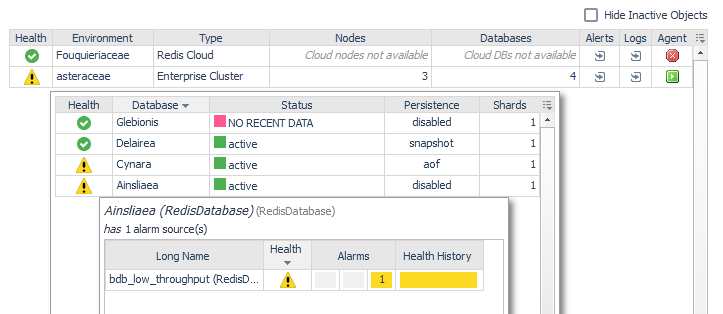
The Redis Environments dashboard lists all monitored Redis environments and provides direct links to the Enterprise Cluster, environment-wide alerts, and logs. Nodes and databases are accessible through popup tables in their respective columns.
Click or hover over an icon in the Health column (excluding Selector popup tables) to view a popup displaying current alerts specific to the object in the selected row.
Use the Hide Inactive Objects checkbox in the upper right to display environments, nodes, and databases with historical data in the Foglight repository but no data in the current time range. By default, the dashboard hides environments monitored by disabled agents, decommissioned nodes, or deleted databases.


