Redis Database
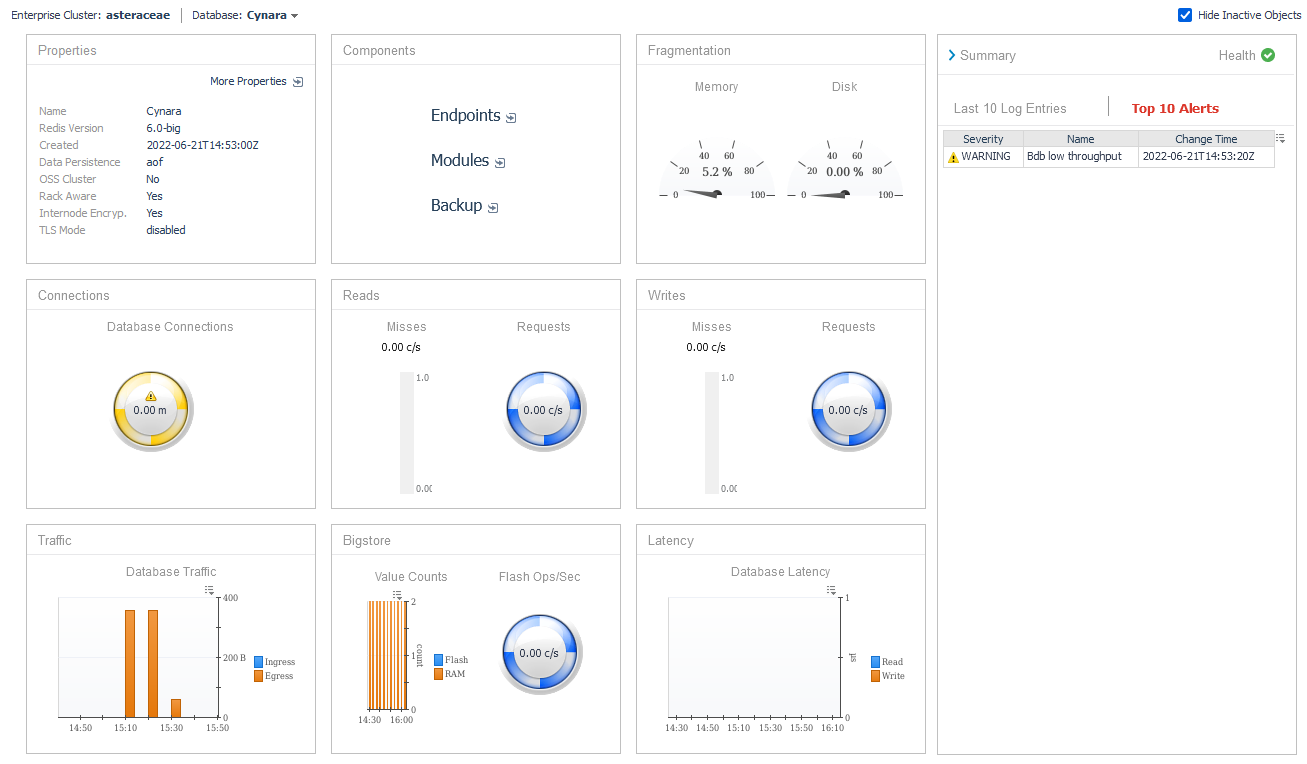
The Redis Database Overview displays detailed information about the properties and statistics of a database. Metrics include database connections, reads, writes, traffic, and latency. For databases using flash storage, Bigstore operation and storage counts are shown, along with disk fragmentation metrics.
The Summary sidebar toggles between the latest 10 environment-wide log entries and the top 10 active alerts for the database, ranked by severity. You can interact with metric indicators, such as spinners, bar charts, or line plots, by clicking or hovering to view expanded diagrams.
Use the Enterprise Cluster selector in the upper left to navigate to the overview of the cluster containing the database. The Database selector allows switching between overviews of other databases within the cluster.


