Redis Enterprise Cluster
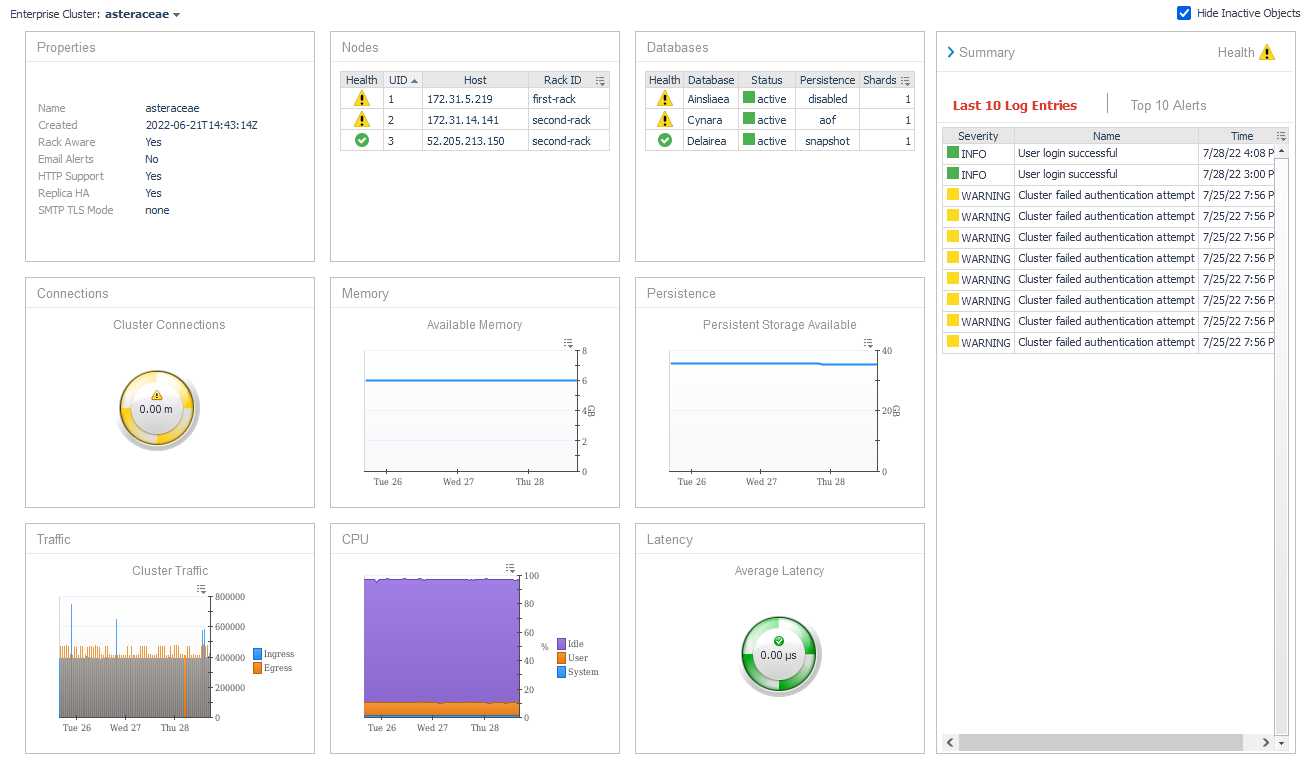
The Redis Enterprise Cluster Overview displays detailed information about the properties and statistics of the cluster. Key metrics include the number of connections, cluster-wide available memory and persistent storage, traffic in and out of the cluster, total CPU usage, and average latency. Links to overview dashboards for all nodes and databases in the environment are provided.
The Summary sidebar toggles between the latest 10 log entries and the top 10 active alerts for the cluster, sorted by severity. To view all alerts across the environment, click a cluster alert or the explore icon in the Redis Environments dashboard to access the Enterprise Alerts dashboard. Similarly, clicking a log entry in the Latest 10 Logs sidebar links to the full Enterprise Logs dashboard.
You can interact with metric indicators, such as spinners, bar charts, or line plots, by clicking or hovering to view expanded diagrams. Use the Enterprise Cluster selector in the top left to switch between clusters, depending on the settings of the Hide Inactive Objects checkbox in the upper right.


