Viewing Dashboards
The Foglight for Redis Cartridge includes the following main dashboards:
This section covers the following areas:
Redis Environments
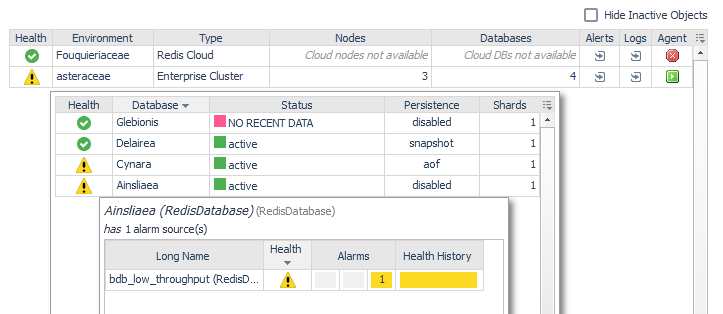
The Redis Environments dashboard lists all monitored Redis environments and provides direct links to the Enterprise Cluster, environment-wide alerts, and logs. Nodes and databases are accessible through popup tables in their respective columns.
Click or hover over an icon in the Health column (excluding Selector popup tables) to view a popup displaying current alerts specific to the object in the selected row.
Use the Hide Inactive Objects checkbox in the upper right to display environments, nodes, and databases with historical data in the Foglight repository but no data in the current time range. By default, the dashboard hides environments monitored by disabled agents, decommissioned nodes, or deleted databases.
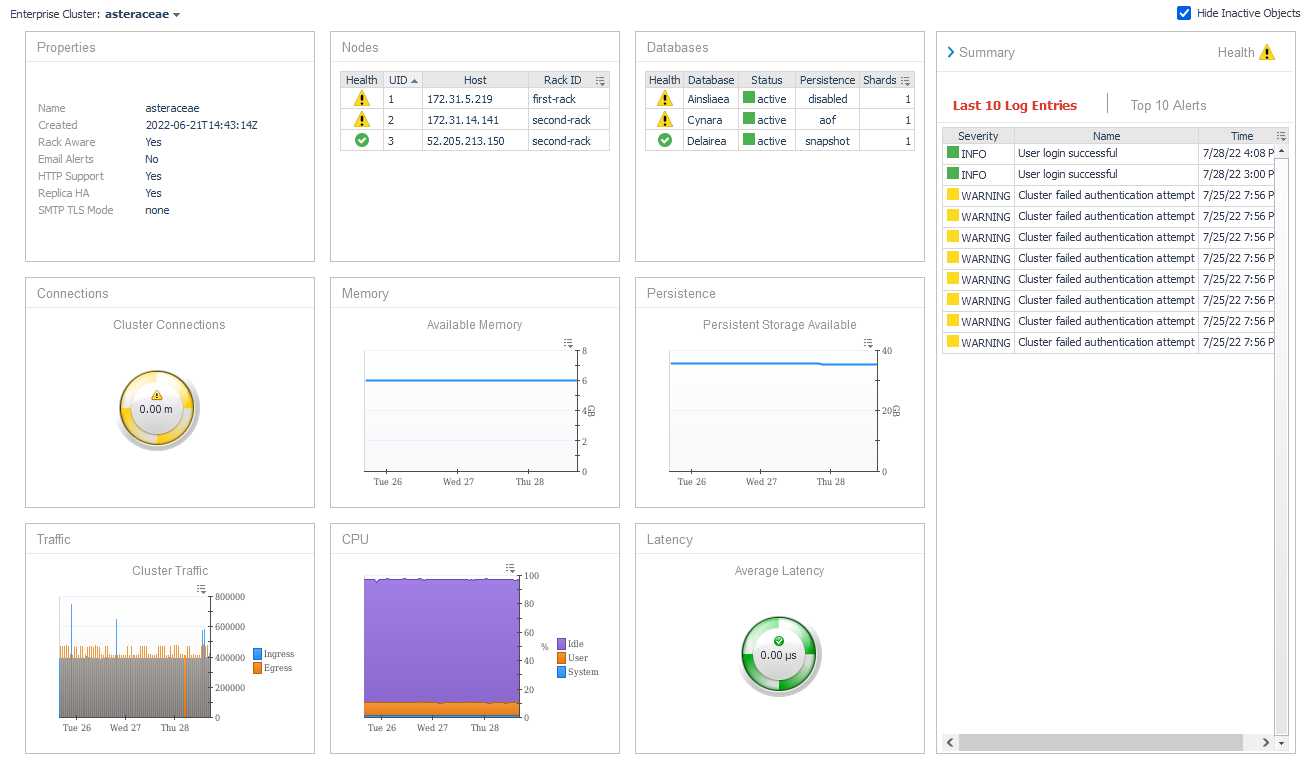
Redis Enterprise Cluster
The Redis Enterprise Cluster Overview displays detailed information about the properties and statistics of the cluster. Key metrics include the number of connections, cluster-wide available memory and persistent storage, traffic in and out of the cluster, total CPU usage, and average latency. Links to overview dashboards for all nodes and databases in the environment are provided.
The Summary sidebar toggles between the latest 10 log entries and the top 10 active alerts for the cluster, sorted by severity. To view all alerts across the environment, click a cluster alert or the explore icon in the Redis Environments dashboard to access the Enterprise Alerts dashboard. Similarly, clicking a log entry in the Latest 10 Logs sidebar links to the full Enterprise Logs dashboard.
You can interact with metric indicators, such as spinners, bar charts, or line plots, by clicking or hovering to view expanded diagrams. Use the Enterprise Cluster selector in the top left to switch between clusters, depending on the settings of the Hide Inactive Objects checkbox in the upper right.
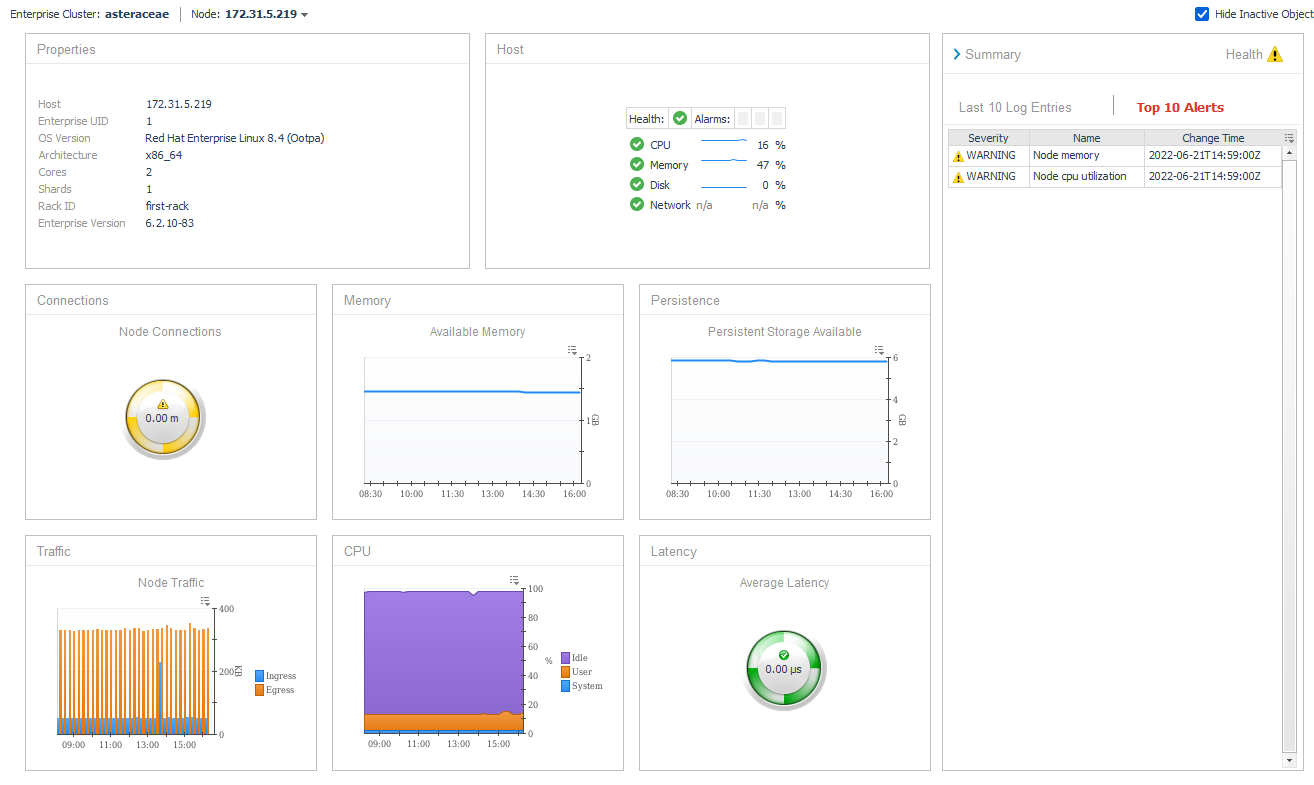
Redis Node
The Redis Node Overview dashboard provides detailed information about the properties and statistics of a Redis node. If the host agent of the infrastructure cartridge is configured, then the dashboard includes direct links to the Host Monitoring dashboard.
Visualized metrics include host connections, available memory, persistent storage, traffic in and out of the node, CPU usage, and average latency. Use the Summary sidebar to toggle between the latest 10 environment-wide log entries within the current time range and the top 10 active alerts scoped to the node, ranked by severity.
You can click or hover over any metric indicator (For example, spinners, bar charts, or line plots) to view an expanded popup diagram. The Enterprise Cluster selector in the upper left allows switching to the cluster overview associated with this node, while the Node selector facilitates switching between overviews of other nodes within the cluster.
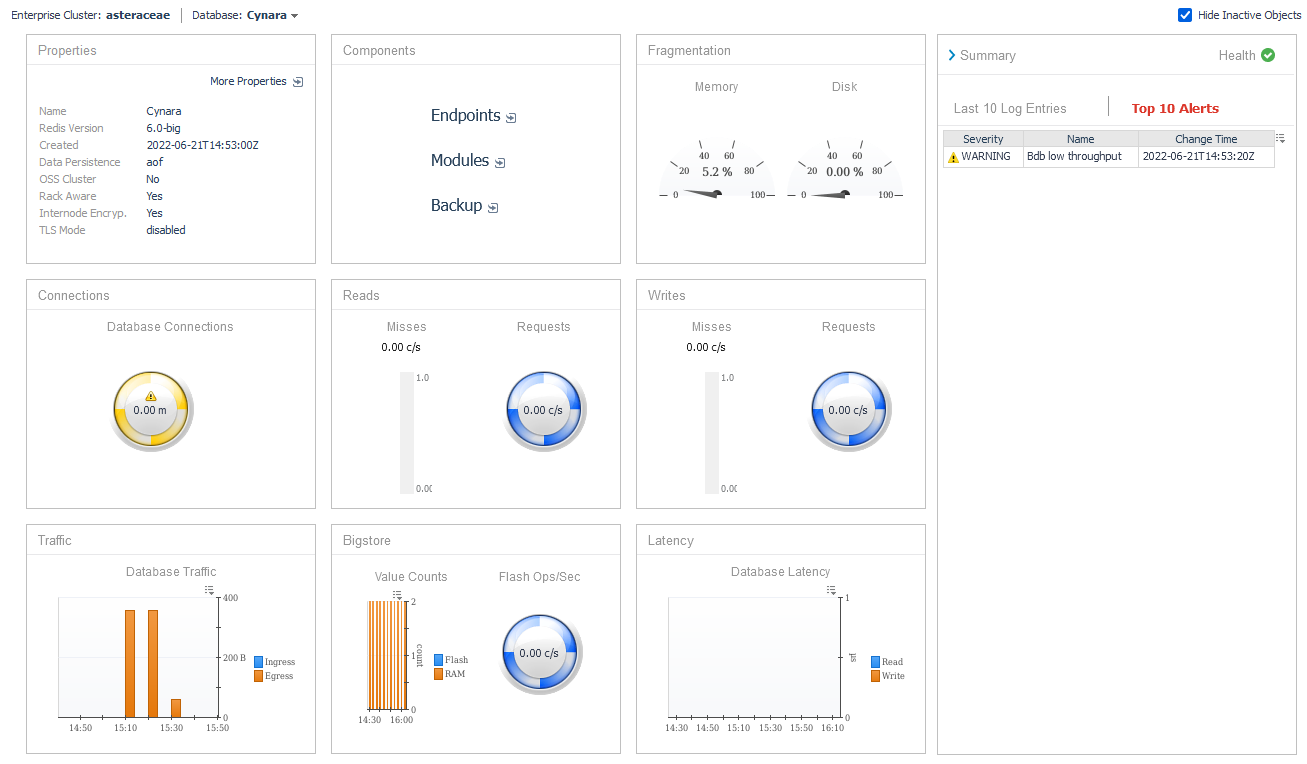
Redis Database
The Redis Database Overview displays detailed information about the properties and statistics of a database. Metrics include database connections, reads, writes, traffic, and latency. For databases using flash storage, Bigstore operation and storage counts are shown, along with disk fragmentation metrics.
The Summary sidebar toggles between the latest 10 environment-wide log entries and the top 10 active alerts for the database, ranked by severity. You can interact with metric indicators, such as spinners, bar charts, or line plots, by clicking or hovering to view expanded diagrams.
Use the Enterprise Cluster selector in the upper left to navigate to the overview of the cluster containing the database. The Database selector allows switching between overviews of other databases within the cluster.
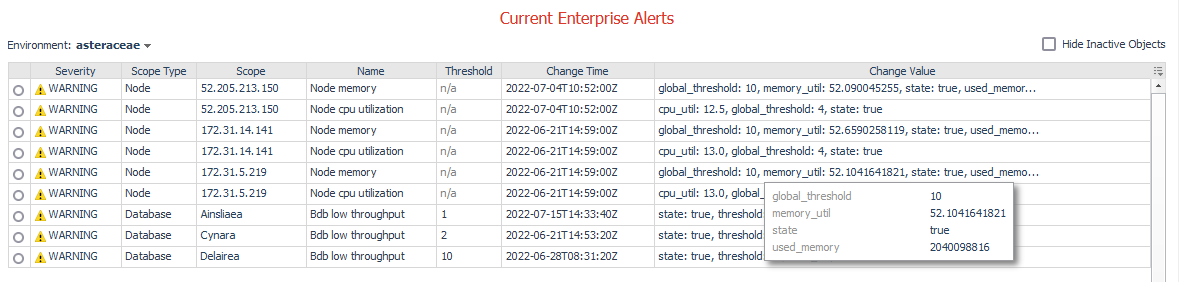
Enterprise Alerts
The dashboard displays active alerts for any object within the environment, including clusters, nodes, and databases. Use the Environment selector in the top-left corner to switch between alerts for different environments. The dashboard consistently shows active alerts and does not adjust based on the current time range. Selecting or hovering over an entry in the Change Value column opens a popup table that lists all key-value pairs for the change value. The Hide Inactive Objects checkbox controls whether environments with no data in the current time range appear in the Environment selector.
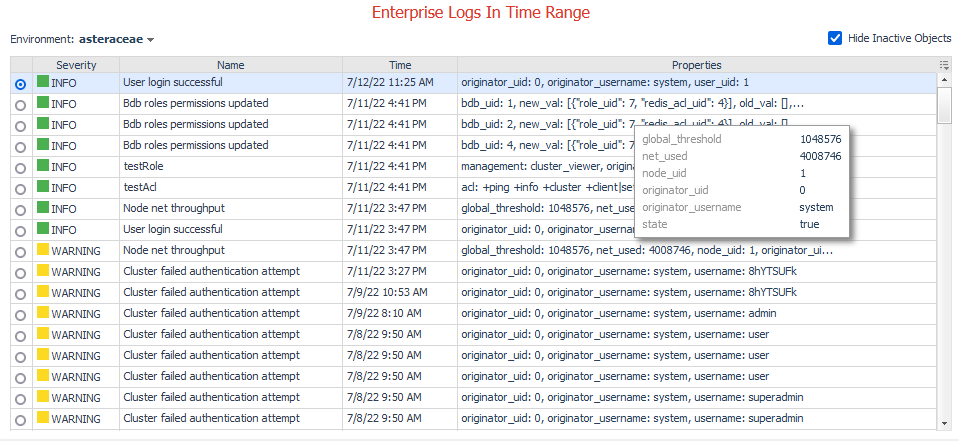
Enterprise Logs
The Enterprise Logs dashboard displays the latest cluster-wide log entries within the current time range. Use the Enterprise Cluster selector in the top left to switch between log entries for different environments.
The dashboard always displays log entries from the current time range. Click or hover over an entry in the Properties column to view a popup table showing all property key-value pairs.
The Hide Inactive Objects checkbox determines whether environments without data in the current time range are displayed in the Environment selector.