Using PostgreSQL Performance Investigator (PI)
The PostgreSQL Performance Investigator (PostgreSQL PI) provides a more in-depth analysis and investigation of the Instance activity and resource consumption.
To view the PostgreSQL PI dashboard:
- In the left navigation pane, click Databases. The Database dashboard displays a list of all instances.
- Click on the required PostgreSQL PI instance from the list.
The PostgreSQL PI dashboard displays the following components:
The Instance View - Provides the ability to investigate and analyze the resource consumption of the instance.
The Performance Tree - Provides iterative access to any dimension associated with PostgreSQL database activity. For more information, refer to Using the Performance Tree.
The Resource Menu - Selecting one resource updates the performance tree, resource consumption charts, and overview section to display only the activity related to the selected resource. For more information, refer to Understanding the overall Instance Activity with the Resource Selector.
This section covers the following key ares:
- Understanding the overall Instance Activity with the Resource Selector
- Using the Performance Tree
- Viewing the Historical Metrics
- Analyzing Blocked Sessions
- Viewing Execution Plans
Understanding the overall Instance Activity with the Resource Selector
The PostgreSQL PI dashboard includes a resource selector that allows you to filter activity by the resource it is waiting for. Each resource indicates a group of several wait events that relate to the same area. By selecting a resource, you set the PI dashboard to show only activity relevant to the resource selected. It also highlights relevant metrics for investigation issues related to the selected resource. For example, by selecting I/O, the performance tree is filtered to show only activity that was waiting for I/O and show metrics like Tuple Deleted/Inserted/Updated.
The following table explains the resources available:
| Resource | Description |
|---|---|
| Workload | This resource enables you to review the instance workload by consolidating all resources into a single view. |
| Client | This resource indicates a backend process is waiting for communication with the client application. Possible causes include network delays, slow client processing, or waiting for user input. |
| I/O | This resource allows you to review I/O-related data, including wait events, and physical reads and writes. |
| IPC | This resource indicates a delay in inter-process communication (IPC) mechanisms, which are used by processes to share data and synchronize actions. |
| LWLock | This resource indicates that the process is waiting for a lightweight lock (LWLock), which is utilized for internal synchronization within PostgreSQL. Excessive LWLock waits may suggest internal contention points. |
| Lock | This resource indicates that the backend process is waiting to acquire a lock on a table or row currently held by another transaction. |
| Other | Miscellaneous instance waits include infrequent or special-purpose wait states that should typically remain close to zero. |
| Process Time | This resource refers to the time spent by the database engine processing a statement. The server process is active and not waiting for resources. A high processing time may indicate a CPU bottleneck. |
Using the Performance Tree
The performance tree provides iterative (up to three levels) access to any of the key dimensions associated with PostgreSQL Server database activity, based on the OLAP multidimensional model and an instance view of the instance activity. Domain nodes offer a hierarchical view of all types of PostgreSQL Server activity characteristics.
Selecting a dimension from the tree determines what subset of activity is displayed. Iterative drill-down into domains of interest provides increasingly refined focus and diagnosis.
For example, to begin the investigation by first identifying the most active DB User, follow the steps described below:
- Select the DB Users node, to display the most active database users in the selected time range. That is, the database users who consumed the highest amount of the selected resource.
- Select the first user, to focus the entire window on that user’s activity.
- Identify the most demanding PostgreSQL statement that this specific user has executed, by expanding the user node and then selecting the PostgreSQL statement dimension node. This displays the most active PostgreSQL statements executed by this user.
- Select a specific PostgreSQL statement to focus the entire window on the selected statement’s activity.
- Select Client Machines under the selected PostgreSQL Statement, to view the computers on which the statement was run.
In a similar manner, such iterative drilldowns can be carried out into any PostgreSQL Server dimension of interest, to gain a complete understanding of the causes of its behavior.
The default PostgreSQL Server dimensions are as follows:
- SQL Statements - Executed SQL commands are listed in a dropdown menu. You can select a specific SQL statement to view details such as Resource Breakdown, Workload Metrics, and Blocked Sessions.
- Databases - The database context in which the session performs its operations. A session may switch between multiple databases during its lifetime.
- Users - Operating system users executing the client program.
- Client Machines - The machines on which the client executable, connected to the PostgreSQL Server, is running.
- Programs - The name of the program that connects to the PostgreSQL Server and executes SQL statements, as specified in the Program column of the PostgreSQL Server session information.
- Sessions - This displays the top sessions that consumed the most active time during the selected time frame.
- Backend Type - The various types of processes currently running on the PostgreSQL server.
Viewing the Historical Metrics
The PostgreSQL PI dashboard is divided into three sections that are correlated to each other:
- Resource breakdown charts - This section displays data in different charts:
- Baseline chart - Displays the instance workload compared to the baseline over time.
- Breakdown chart - Activity of the instance by second.
- Resource Breakdown Pie chart - Displays the resource breakdown usage by % of the total instance activity.
- All wait events pop up - Displays details of the wait events that the instance is waiting on during the selected time range.
- Workload Metrics - A table that displays various resource consumption metrics, providing an in-depth view of instance activity. Each resource includes its default metrics. Selecting each dimension in the performance tree along with a specific resource affects the data displayed at each level. For example, selecting the Lock resource will cause the Instance view dimension to show only lock-related data. The SQL Statements dimension will display only the statements that were experiencing locks, and the DB Users dimension will present only the users affected by locks. This filtering applies across all dimensions and resources
- Blocked Sessions - This section displays the list of blocked sessions for a specific timeframe. For more information, refer to Analyzing Blocked Sessions.
The Workload Metrics section displays parameters such as name, resource, average, min, max, total, and per execution for each metric.
The metrics listed in the table below are available only for certain dimension levels.
| Resource menu | Default Metrics Available |
|---|---|
| Workload | - Active Time - Displays the sum of all active waits and processing time represents the total activity within the current time interval. - Average SQL Response Time - Displays the average duration of the statements executed during the current time interval is calculated as the elapsed time divided by the execution count. - Commits Rate - Displays the frequency at which transactions are committed. - Elapsed Time - Displays the total time consumed for executing the statements. - Executions - Displays the number of times statements were executed that were active during the current interval. - Rollbacks Rate - Displays the frequency at which transactions are rolled back. - Used Connections - Displays the number of connections (sessions) established between client applications and the PostgreSQL database server. - Wait Time Percent - Displays the percentage of time spent waiting for resources, such as CPU and I/O, relative to the total active time. - Waiting Connections - Displays the number of connections (sessions) that are waiting for resources to proceed with their tasks. |
| Client | - Active Time - Displays the sum of all active waits and processing time represents the total activity within the current time interval. - Average SQL Response Time - Displays the average duration of the statements executed during the current time interval is calculated as the elapsed time divided by the execution count. - Commits Rate - Displays the frequency at which transactions are committed. - Elapsed Time - Displays the total time consumed for executing the statements. - Executions - Displays the number of times statements were executed that were active during the current interval. - Rollbacks Rate - Displays the frequency at which transactions are rolled back. - Used Connections - Displays the number of connections (sessions) established between client applications and the PostgreSQL database server. - Wait Time Percent - Displays the percentage of time spent waiting for resources, such as CPU and I/O, relative to the total active time. - Waiting Connections - Displays the number of connections (sessions) that are waiting for resources to proceed with their tasks. |
| I/O | - Active Time - Displays the sum of all active waits and processing time represents the total activity within the current time interval. - Average SQL Response Time - Displays the average duration of the statements executed during the current time interval is calculated as the elapsed time divided by the execution count. - Commits Rate - Displays the frequency at which transactions are committed. - Elapsed Time - Displays the total time consumed for executing the statements. - Executions - Displays the number of times statements were executed that were active during the current interval. - Rollbacks Rate - Displays the frequency at which transactions are rolled back. - Tuple Deleted Rate - Displays the frequency at which tuples (rows of data) are deleted. - Tuple Inserted Rate - Displays the frequency at which tuples (rows of data) are inserted. - Tuple Updated Rate - Displays the frequency at which tuples (rows of data) are updated. - Used Connections - Displays the number of connections (sessions) established between client applications and the PostgreSQL database server. - Waiting Connections - Displays the number of connections (sessions) that are waiting for resources to proceed with their tasks. - I/O Wait - Displays the time spent by the various sessions waiting for data to be read from or written to disk. |
| LWLock | - Active Time - Displays the sum of all active waits and processing time represents the total activity within the current time interval. - Average SQL Response Time - Displays the average duration of the statements executed during the current time interval is calculated as the elapsed time divided by the execution count. - Commits Rate - Displays the frequency at which transactions are committed. - Elapsed Time - Displays the total time consumed for executing the statements. - Executions - Displays the number of times statements were executed that were active during the current interval. - Rollbacks Rate - Displays the frequency at which transactions are rolled back. - Used Connections - Displays the number of connections (sessions) established between client applications and the PostgreSQL database server. - Waiting Connections - Displays the number of connections (sessions) that are waiting for resources to proceed with their tasks. - LWLOCK Wait - Displays the time spent by the various sessions waiting for internal synchronization within PostgreSQL. |
| Lock | - Active Time - Displays the sum of all active waits and processing time represents the total activity within the current time interval. - Average SQL Response Time - Displays the average duration of the statements executed during the current time interval is calculated as the elapsed time divided by the execution count. - Commits Rate - Displays the frequency at which transactions are committed. - Deadlocks - Displays the total number of deadlocks. Deadlock occurs when two or more transactions are struck, each waiting for the other to release a resource they need. - Executions - Displays the number of times statements were executed that were active during the current interval. - Rollbacks Rate - Displays the frequency at which transactions are rolled back. - Used Connections - Displays the number of connections (sessions) established between client applications and the PostgreSQL database server. - Waiting Connections - Displays the number of connections (sessions) that are waiting for resources to proceed with their tasks. - Lock Wait - Displays the time spent by the various sessions waiting to acquire a lock on a table or row that is currently held by another transaction. |
| Process Time | - Active Time - Displays the sum of all active waits and processing time represents the total activity within the current time interval. - Average SQL Response Time - Displays the average duration of the statements executed during the current time interval is calculated as the elapsed time divided by the execution count. - Commits Rate - Displays the frequency at which transactions are committed. - Elapsed Time - Displays the total time consumed for executing the statements. - Executions - Displays the number of times statements were executed that were active during the current interval. - Rollbacks Rate - Displays the frequency at which transactions are rolled back. - Used Connections - Displays the number of connections (sessions) established between client applications and the PostgreSQL database server. - Waiting Connections - Displays the number of connections (sessions) that are waiting for resources to proceed with their tasks. - Process Time - Displays the time spent by DB engine to process statement (the server process is active and does not wait for resources). |
Analyzing Blocked Sessions
This section displays the details of the blocked session, the session that is causing the block, and any deadlock sessions. To view blocked sessions for a specific timeframe, click the Duration dropdown list, select the minimum and maximum time range limit, and then click Apply. You can view the following metric parameters for the sessions:
- Start Date- (Default) Displays the start date of the session (date-time format).
- End Date- Displays the end date of the session (date-time format).
- Session- (Default) Displays the session ID.
- Blocked By- (Default)
- Status - (Default) A selection out of possible values
- Object Name - Displays the object name.
- Duration- (Default)
- Program- (Default) Name of a program that connects to PostgreSQL Server and executes the SQL statements, as specified in the Program column of the PostgreSQL Server session information.
- DB User- (Default) PostgreSQL Server login names used for logging in to PostgreSQL Server.
- Client Machine- Displays the machines on which the client executable (connected to PostgreSQL server) is running.
- SQL ID- Displays the SQL ID of the session.
- SQL Text- (Default) Displays the SQL text for the selected SQL statement.
Viewing Execution Plans
PostgreSQL generates a query plan for each query it processes, selecting an execution strategy based on the query structure and data properties. Efficient query planning is essential for performance, and PostgreSQL’s query planner evaluates multiple strategies to determine the most effective approach. You can use the EXPLAIN command to view the execution plan and gain insights into how PostgreSQL processes a query. It helps in optimizing query performance.
The EXPLAIN command can be used in different types, each serving a specific purpose:
- Explain Only:
Displays the execution plan that PostgreSQL plans to use for a query, without actually executing the query. This mode is useful for understanding how PostgreSQL intends to execute a query, which can help in identifying potential performance issues. It provides the planned execution steps, such as whether it will use a sequential scan or an index scan.
- Analyze:
This mode executes the query and provides the actual execution statistics along with the execution plan. This is beneficial for comparing the planned execution with the actual performance, helping to identify discrepancies and optimize queries. It includes actual time taken for each step, number of rows processed, and other runtime statistics.
- Analyze with Rollback:
This mode allows you to analyze queries that modify data (e.g., INSERT, UPDATE, DELETE) without permanently affecting the database. As the Analyze mode executes the query, using it on data-modifying statements would change the data. To prevent this, you can run the analysis within a transaction and roll it back afterward. It provides the execution plan and actual performance metrics without committing the changes to the database.
Running an Explain Plan may consume system resources. Additionally, executing Analyze without Rollback can modify your data.
Prerequisites
Before using the PostgreSQL PI execution plan, ensure that the prerequisites are met. For more information refer to Prerequisites for Using PostgreSQL PI Execution Plan.
Viewing the Execution Plan Details
To view the execution plan within PI:
On the PostgreSQL Server dashboard, click SQL PI from the menu. The SQL PI dashboard gets displayed.
Click Statements under Instances in the left pane, then select the query for which you want to view the execution plan.
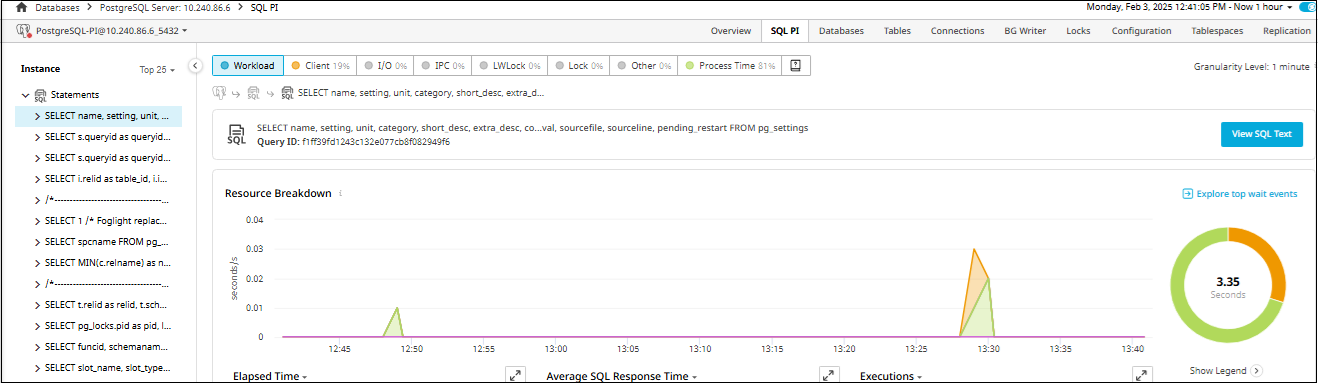
Click View SQL Text. The SQL Text dialog box that displays name, query ID, and text appears. You can edit the SQL text. If the text contains errors, a syntax error message will be displayed.
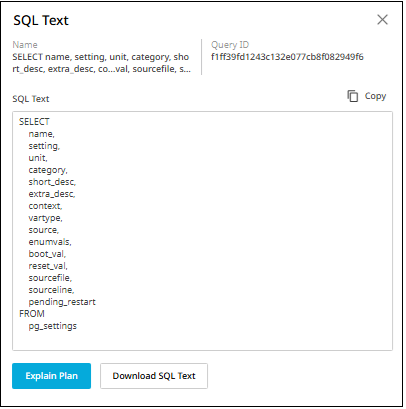
Click Explain Plan. The Explain/Analyze Setup dialog box appears.
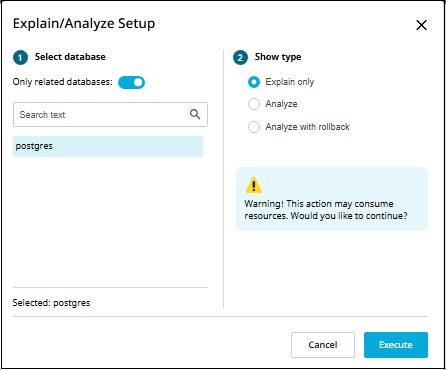
In the Select Database section, select the database where you want to execute the statement.
In the Show Type section, select the required option and click Execute. The Execution Plan dashboard appears.
Only the Analyze type displays the query execution plan along with real-world execution statistics to support optimization efforts.
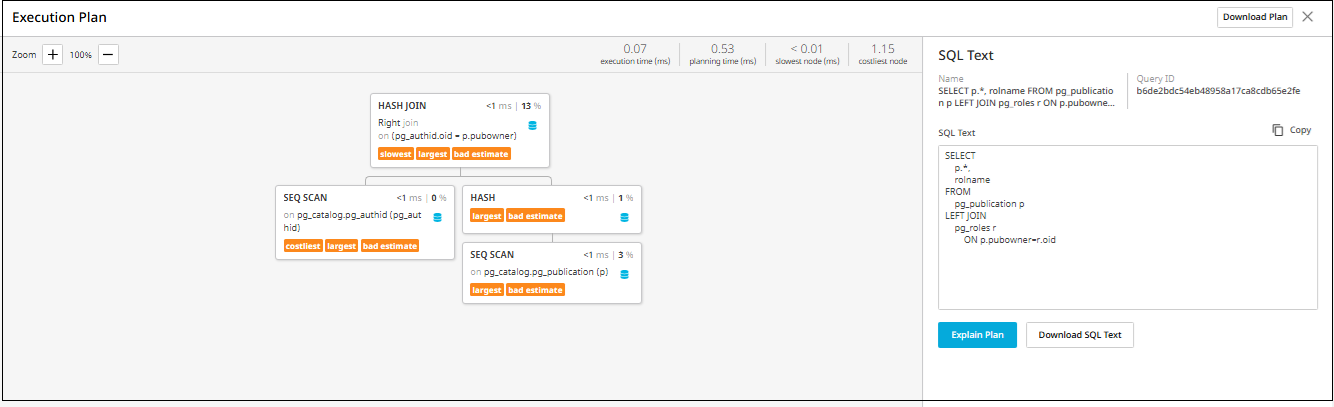
The execution plan displays information on operations like sequential scans, index scans, joins, and aggregations, as well as the order of these operations and associated cost estimates.
When analyzing execution plans in Foglight PI, you may encounter the following terms. These terms help identify potential performance bottlenecks:
Costliest- This indicates the operations within the execution plan that have the highest estimated cost. The PostgreSQL query planner assigns a cost to each operation based on factors like I/O operations, CPU usage, and memory consumption. Identifying the costliest operations can help in pinpointing areas where query performance can be optimized.
Slowest- This indicates the operations within the execution plan that consume the most time. Identifying these steps can help in pinpointing areas where query performance can be optimized.
Largest- This refers to operations that handle the most data, either in terms of rows processed or data volume. Such operations can impact memory usage and overall query efficiency.
Bad Estimate- This highlights discrepancies between the planner’s estimated row counts and the actual number of rows processed. Significant variances can indicate outdated statistics or suboptimal query plans, leading to inefficient execution strategies.
You can configure Performance Investigator (PI) to gain deeper insights into database performance. For more information, refer to Configuring PostgreSQL Performance Investigator (PI)