Tablespaces
Overview
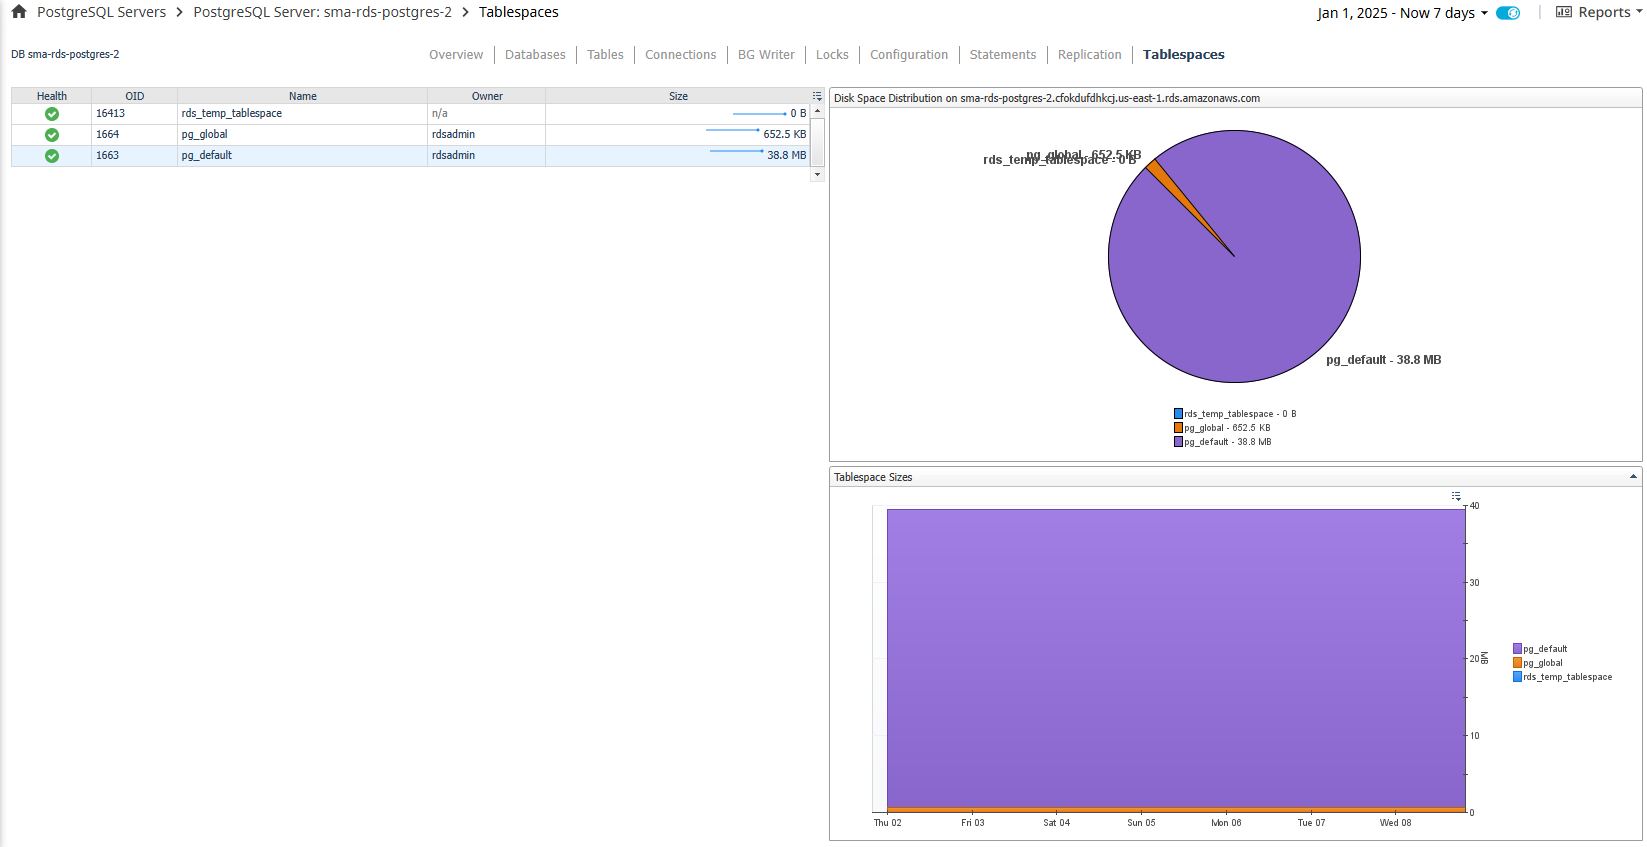
The Tablespaces page shows tablespaces used by the selected PostgreSQL server. The table on the left displays a row for each tablespace while the graphs on the right show a visual distribution of disk spaze. In the action panel on the right pane, the PostgreSQL Agent Selector allows you to switch between PostgreSQL servers.
Data
Table
- Health – Shows the overall health of the tablespace.
- OID – OID of the tablespace.
- Name – Name of the tablespace.
- Owner – Owner of the tablespace.
- Size – Disk size of the tablespace.
Graphs
- Disk Space Distribution – Shows the distribution of disk space on the host between tablespaces, other used space, and free space. If host storage information is not being collected, only tablespace sizes are shown.
- Tablespace Sizes – Compares tablespace sizes to each other and shows combined total space used.
Actions
- Health (dwell or drilldown) - Shows a breakdown of child objects in a warning, critical, or fatal state.
- Size (dwell) – A popup time plot of the disk size.