Tables
Overview
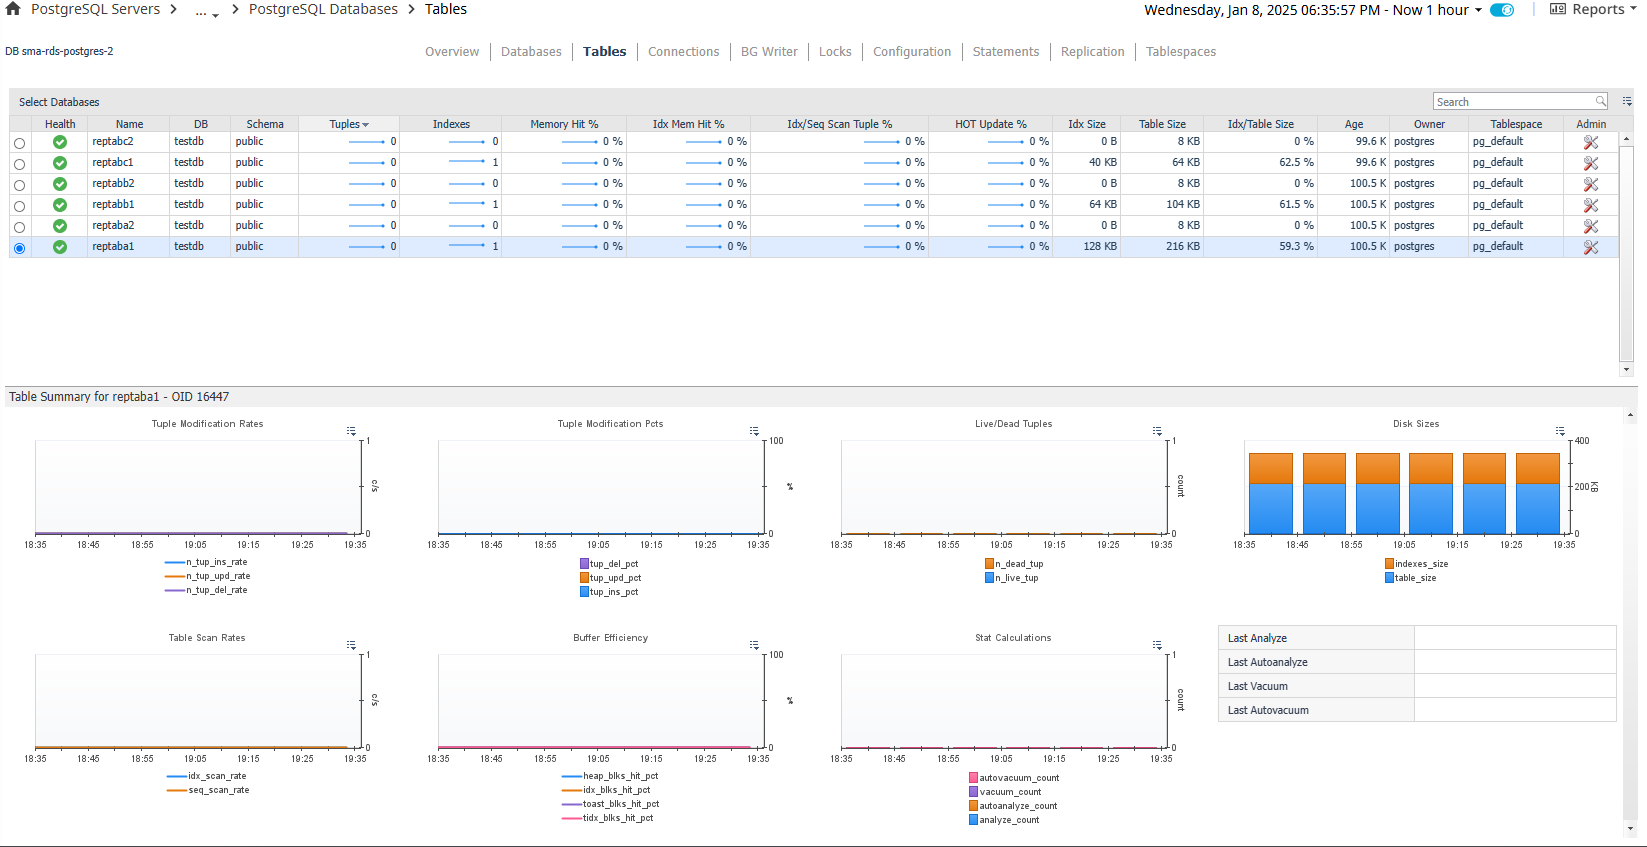
The Tables page contains 2 sections separated by a horizontal splitter: the top section, which displays a row for each table as well as some key information, and the bottom section, which displays metric information related to the table selected in the top section. The size of the two sections can be increased or decreased by dragging the horizontal splitter bar up or down. In the action panel on the right pane, the DB Selector allows you to switch between databases or show tables from all databases.
Data
Top Section – Tables Table
- Health – Shows the overall health of the table.
- Name – The name of the table.
- DB – The database that contains the table.
- Schema – The schema that contains the table.
- Tuples – The number of tuples in the table.
- Indexes – The number of indexes in the table.
- Memory Hit % - Percentage where a read from the table or any related resource is successfully sourced from buffer cache rather than needing physical disk I/O.
- Idx Mem Hit % – Percentage where a read from the table indexes is successfully sourced from buffer cache rather than needing physical disk I/O.
- Idx/Seq Scan Tuple % – Percentage of tuples returned from index vs. sequential scans.
- HOT Update % – Percentage of rows updated by HOT.
- Idx Size – Disk size of all index tables associated with the table**.**
- Table Size – Disk size of the table.
- Idx/Table Size – Ratio of index size to table size.
- Owner – Owner of the table.
- Tablespace – Tablespace where table data is stored.
Bottom Section – Table Metrics
- Tuple Modifications Rates – Rate of tuples modified by deletion, update, or insert operations.
- Tuple Modification Pcts – Distribution of modification operations affecting table tuples.
- Live/Dead Tuples – Counts of live and dead tuples in table memory. Dead tuples are deleted rows that have not yet been cleaned up.
- Disk Sizes – Disk sizes of table, table indexes, and total table size, including related resources.
- Table Scan Rates – Rates of index and sequential scans on this table.
- Buffer Efficiency – Breakdown of memory block hits by table resource.
- Stat Calculations – Counts of vacuum and analyze operations.
- Last…Operation – Timestamp of last operation on the table.
Actions
Table Table
- Health (dwell or drilldown) - Shows a breakdown of child objects in a warning, critical, or fatal state.
- DB (drilldown) – Navigates to the Database page for the selected table.
- Tuples (dwell) – A popup time plot of the tuple count.
- Indexes
- Dwell – A popup time plot of the index count.
- Drilldown – Navigates to the indexes page.
- Memory Hit % (dwell or drilldown) - A popup time plot of the memory hit percentage.
- Idx Mem Hit % (dwell or drilldown) - A popup time plot of the index memory hit percentage.
- Idx/Seq Scan Tuple % (dwell or drilldown) - A popup time plot of the index/sequential scan tuple percent.
- HOT Update % (dwell or drilldown) - A popup time plot of the HOT update percent.
- Idx Size (dwell or drilldown) - A popup time plot of the index size.
- Table Size (dwell or drilldown) - A popup time plot of the table size.
- Idx/Table Size (dwell or drilldown) - A popup time plot of the index/table size.
- Tablespace
- Dwell - A popup table with the tablespace’s health, OI, owner, and disk size.
- Drilldown – Navigates to the Tablespaces page.
Admin Actions
If your user account has the PostgreSQL Administrator role and the PostgreSQL user provided to the agent has the appropriate permissions, you can perform administrative actions on the server from the dashboard. Click the icon in the Admin table column to perform one of the following actions:
- Vacuum + Analyze – Perform a VACUUM ANALYZE operation on the table.
- Vacuum – Perform a VACUUM operation on the table.
- Analyze – Perform an ANALYZE operation on the table.
- Stat Reset – Reset the statistic counts on the table.