Statements
Overview
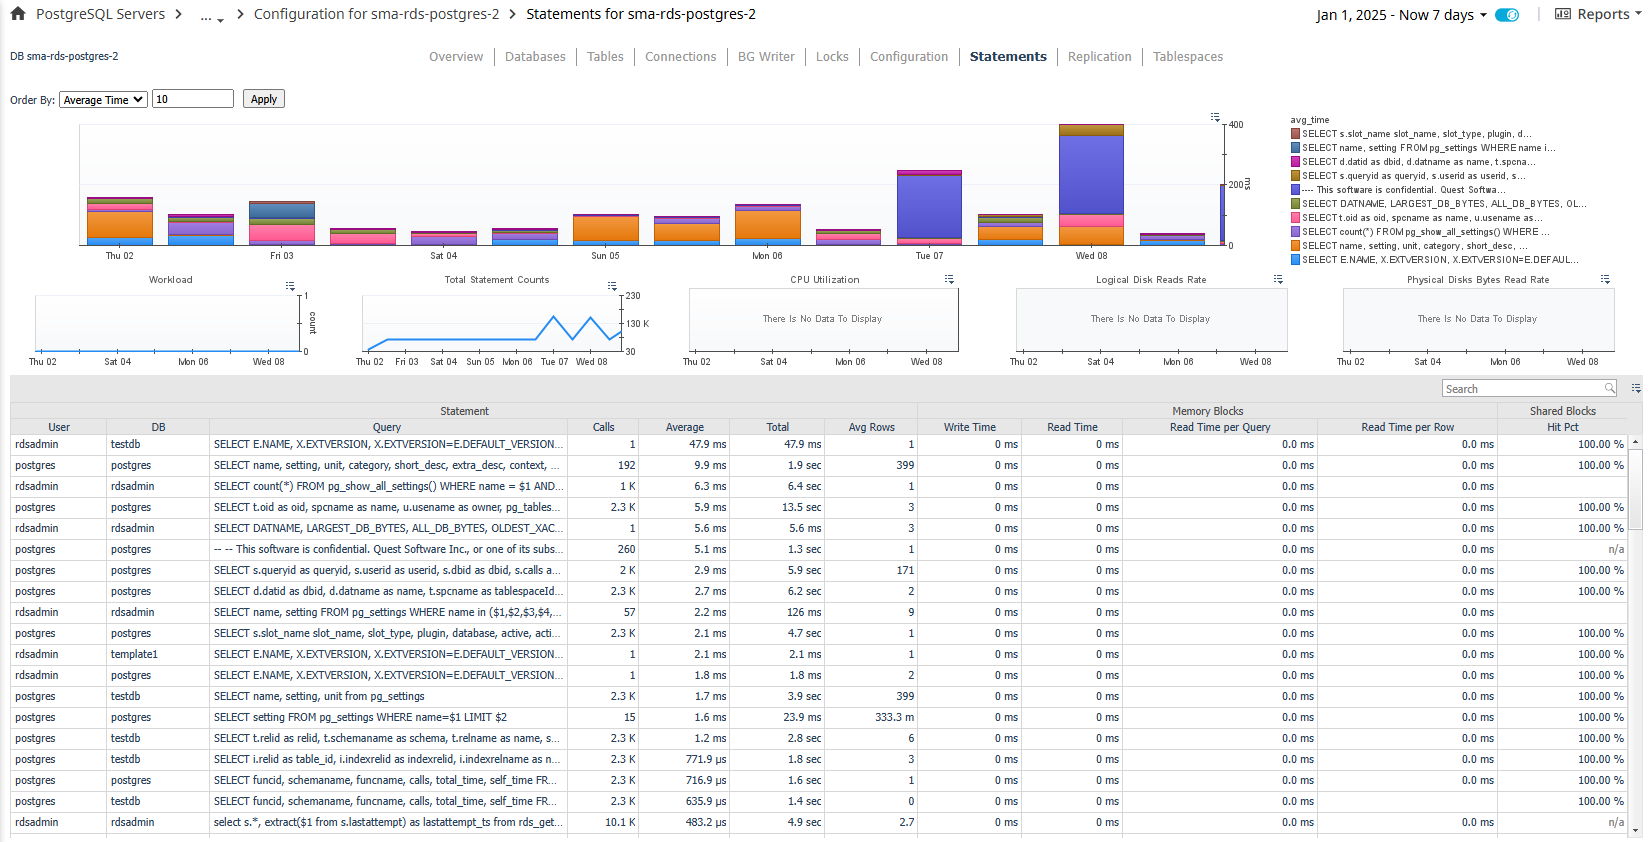
If Statement Tracking is enabled, the Statements dashboard shows a number of the top statements collected from the server, sorted and limited by fields specified in the Agent Properties. The bar graph can be customized using the fields above it to show top statements by several categories. The graphs below show workload, statement counts, and system utilization metrics (if host is being monitored), in order to allow the user to correlate potentially problematic statements with impact on the system. Below, a table lists all collected statements that have been called in the selected time period. Many of these fields are hidden by default for space considerations, but can be made visible by using the customizer at the top right of the table. A default search filter is set in the top-right section of the table to exclude calls made to system databases, usually internal processes or monitoring queries. This can be cleared or modified to show different results in the table. In the action panel on the right pane, the PostgreSQL Agent Selector allows you to switch between servers without leaving the page.
To enable statement tracking, refer to Statement Monitoring.
You can view PostgreSQL PI as an alternative to SQL statements in PostgreSQL. For more information, refer to Using PostgreSQL Performance Investigator (PI).
Data
Statements Table
- Statement
- User – Name of the user that executed the statement.
- User ID – ID of the user that executed the statement.
- DB – Name of the database in which the statement was executed.
- DB ID – ID of the database in which the statement was executed.
- Query – Text of a representative statement (up to track_activity_query_size bytes). Statements with the same operations plan may have slight differences in the original text, but are represented by a single statement.
- Calls – Number of times the statement has been executed.
- Rows - Total number of rows retrieved or affected by the query.
- Average – Average time spent executing the statement per call.
- Total – Total time spent executing statements.
- Memory Blocks
- Write Time - Total time the statement spent writing blocks (if track_io_timing is enabled, otherwise zero).
- Read Time - Total time the statement spent reading blocks (if track_io_timing is enabled, otherwise zero).
- Read Time per Query - Time the statement spent reading blocks per query.
- Read Time per Query - Time the statement spent reading blocks per row retrieved/affected.
- Shared Blocks
- Hit Pct – Percentage of shared block cache hits of total blocks read.
- Read – Number of shared blocks read.
- Hit – Number of shared block cache hits.
- Written – Number of shared blocks written.
- Dirtied – Number of shared blocks dirtied.
- Local Blocks
- Read – Number of local blocks read.
- Hit – Number of local block cache hits.
- Written – Number of local blocks written.
- Dirtied – Number of local blocks dirtied.
- Temp Blocks
- Read – Number of temp blocks read.
- Written – Number of temp blocks written.
Actions
Statements Graph
- Bar Section (dwell) – Popup of selected statement details.
- Bar Section (drilldown) – Navigates to the Statement Details page.
Statements Table
- DB (drilldown) – Navigates to the Databases dashboard with DB selected.
- Query (drilldown) - Shows the full query text in a formatted, colored state for better readability.
- Other metrics (drilldown or dwell) – Shows a popup time plot for the selected metric.
You can click on the required statement to view its details on the Statement Details dashboard.