Statements Details
Overview
The Statement Details page provides a more in-depth look at the operations and history of a particular statement as well as its performance on other monitored servers, if the same queryid has been found. This page also features the Explain Plan Request form, which can be used to request an explain plan for the statement if it has been enabled in the agent properties and the Foglight user has the PostgreSQL Administrator role.
Data
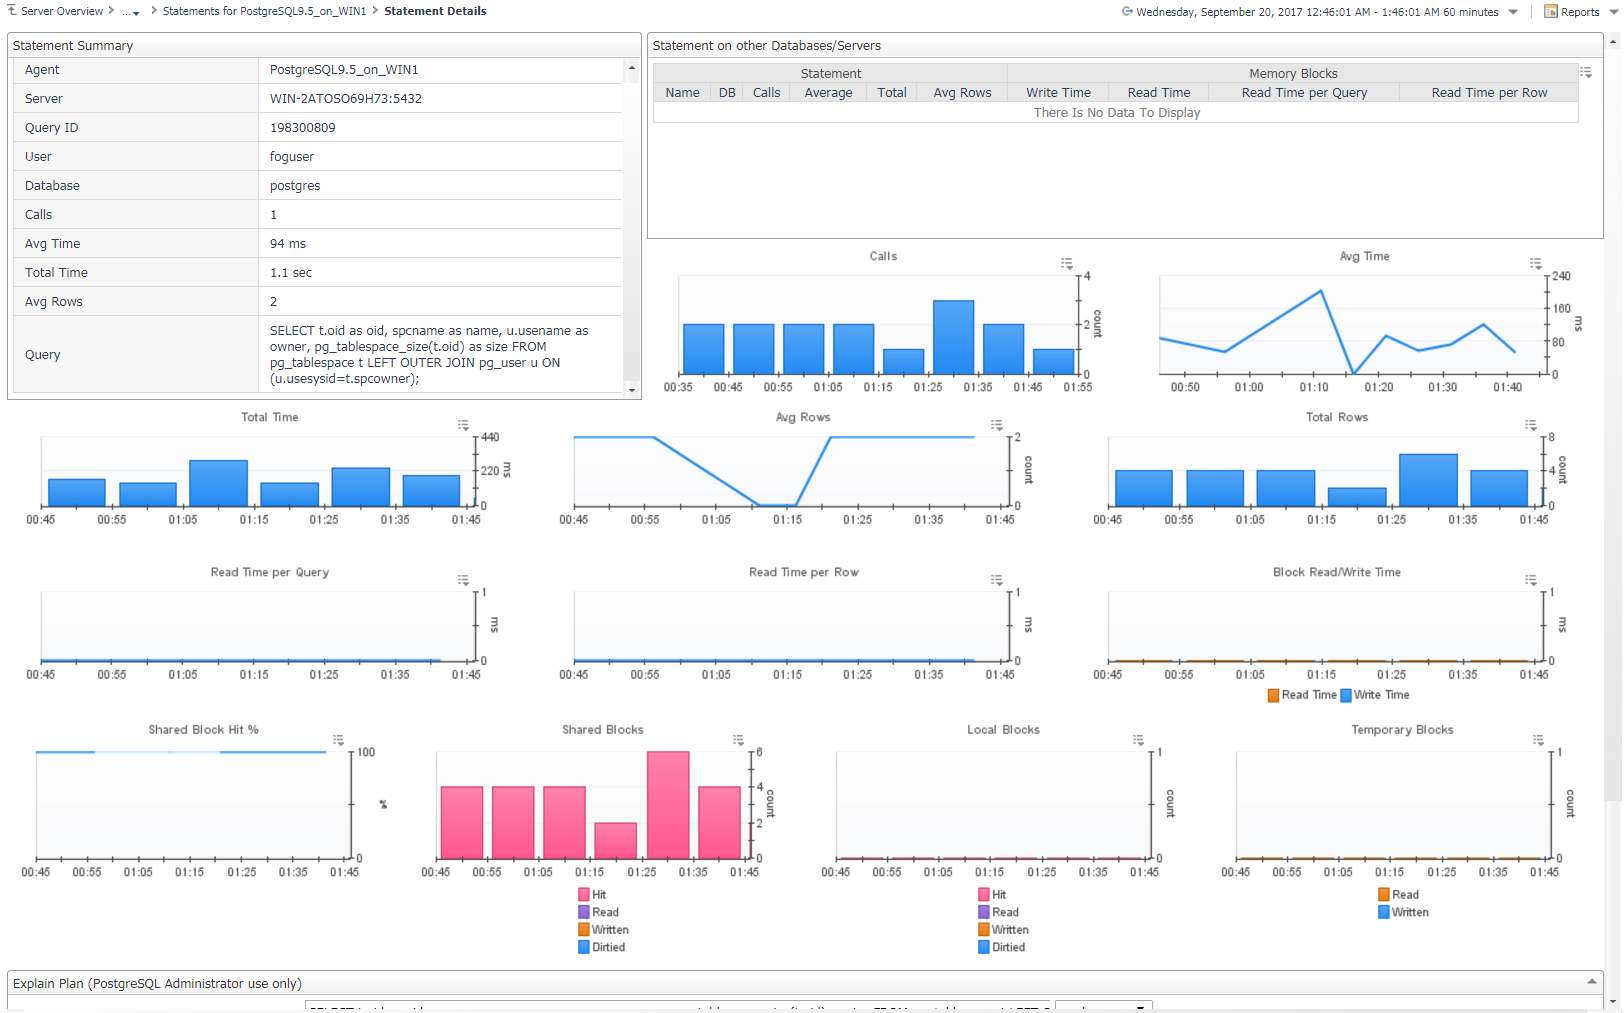
- Statement Summary
- Agent – Agent monitoring the PostgreSQL Server.
- Server – The host:port of the PostgreSQL server.
- Query ID – An internally-generated hash calculation. For versions below 9.4, where queryid is not available from the server, a hash code has been generated by the agent based solely on a concatenation of the database name and query text
- User – Name of the first user that executed the statement.
- Database – Name of the database in which the statement was executed.
- Calls – Number of times the statement has been executed.
- Average Time – Average time spent executing the statement per call.
- Total Time – Total time spent executing statements.
- Avg Rows – Average number of rows retrieved or affected by the query.
- Query – Text of a representative statement (up to track_activity_query_size bytes). Statements with the same operations plan may have slight differences in the original text, but are represented by a single statement.
- Statements On Other Servers
- This table shows performance of the same query on other monitored PostgreSQL servers on which it may be performed, for comparison to the selected server.
In order to match the queries across servers, this table relies on the queryid which is not guaranteed to be the same across servers.
Per PostgreSQL documentation (https://www.postgresql.org/docs/current/static/pgstatstatements.html ):
“As a rule of thumb, queryid values can be assumed to be stable and comparable only so long as the underlying server version and catalog metadata details stay exactly the same. Two servers participating in replication based on physical WAL replay can be expected to have identical queryid values for the same query. However, logical replication schemes do not promise to keep replicas identical in all relevant details, so queryid will not be a useful identifier for accumulating costs across a set of logical replicas. If in doubt, direct testing is recommended.”
- Other Graphs
- Represent historical views of metrics listed on the Statements page table.
Actions
Statements On Other Servers Table
- Name (drilldown) – Switches the page to represent the same statement as performed on the selected server.
Explain Plan Request
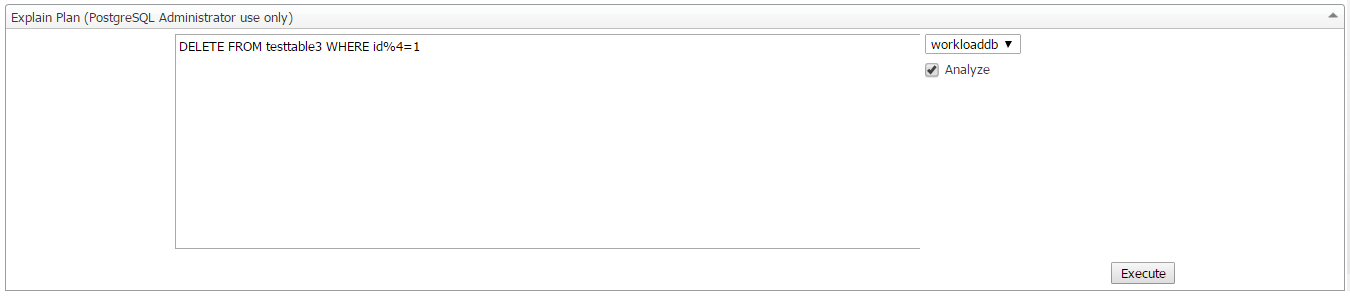
If Enable Explain Plans is set to true in the agent properties, this form allows a user with the PostgreSQL Administrator role to request explain plans. The text area field will be pre-filled with the normalized query text of the statement being investigated. It can (or must be) modified to an appropriate form for the PostgreSQL server to consider it a legitimate statement (? replaced with real numerical or string values). The database is also auto-selected, but may be switched.
If Enable Explain Analyze has been set to true in the agent properties, the Analyze option in this form will be selectable. If selected, the EXPLAIN ANALYZE command will carry out the command on the server and return actual run times and other statistics. Administrators should be very careful when using this option. If unset, the server will not actually run the query and will instead return an expected execution plan.
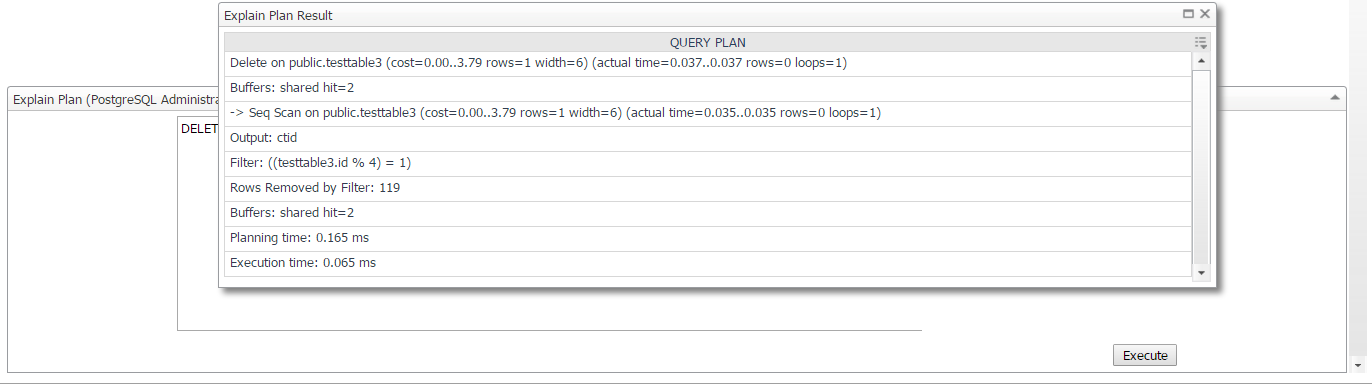
When done, click the Execute button to request the Explain plan and wait. After a short time, a popup should launch with the results of the explain plan request similar to the screenshot below. The Foglight user and statement performed will also be logged to the Agent Log.