Server Overview
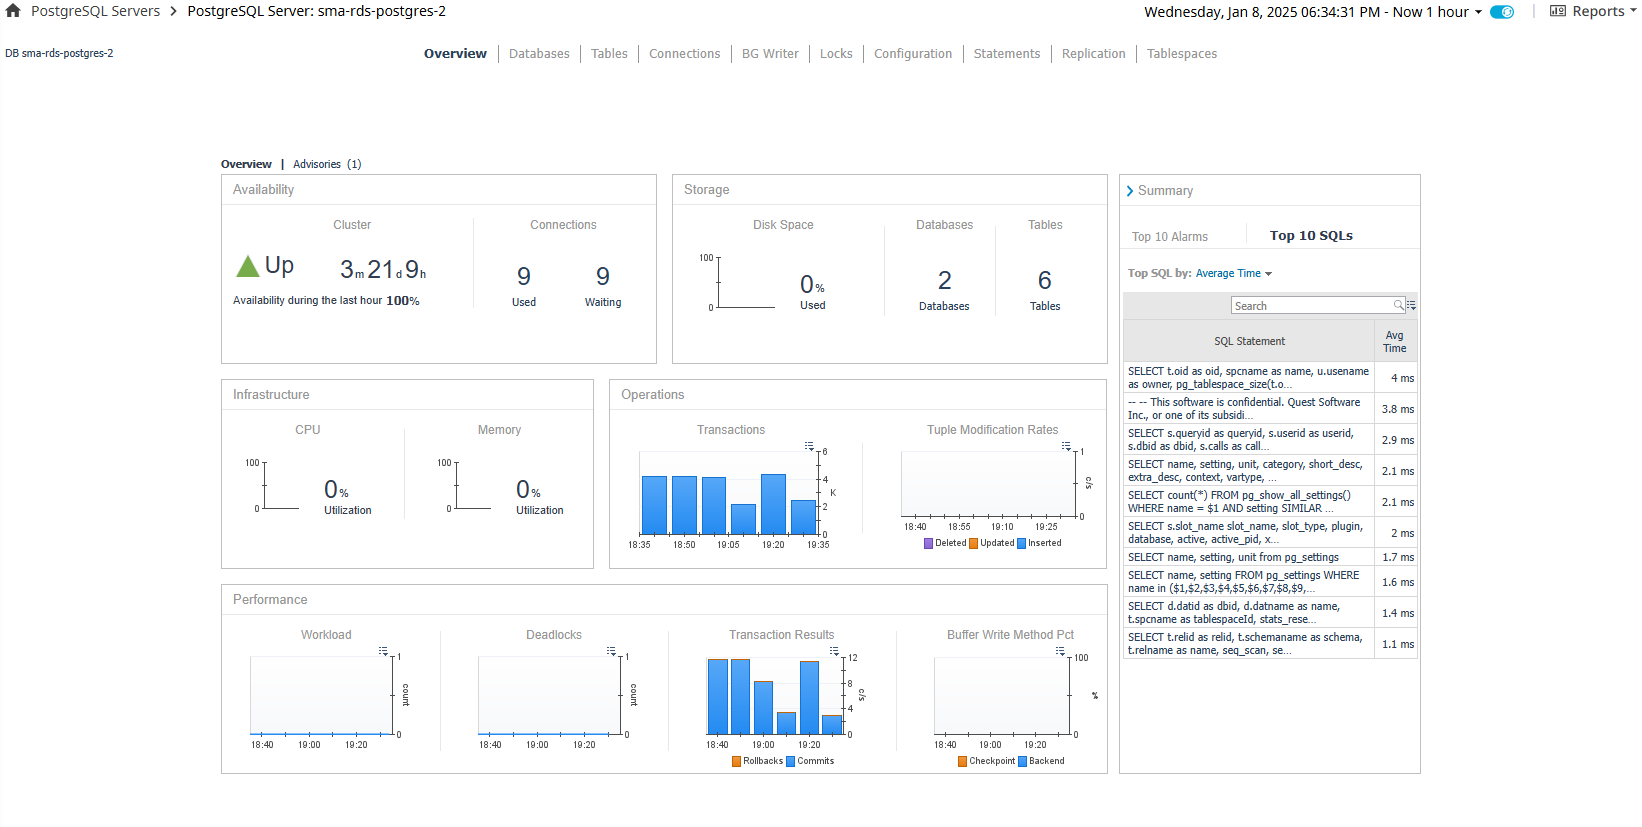
The Server Overview dashboard gives an overview of key segments for the PostgreSQL server, including host metrics. Information includes availability and connection status, storage and host information, and operations and performance metrics. The right side of the page features an expandable summary box that can display the Top 10 SQL executed in the current time range by one of several metrics or the Top 10 Alarms currently active for this server. In the action panel on the right pane, the PostgreSQL Agent Selector allows you to switch between PostgreSQL servers.
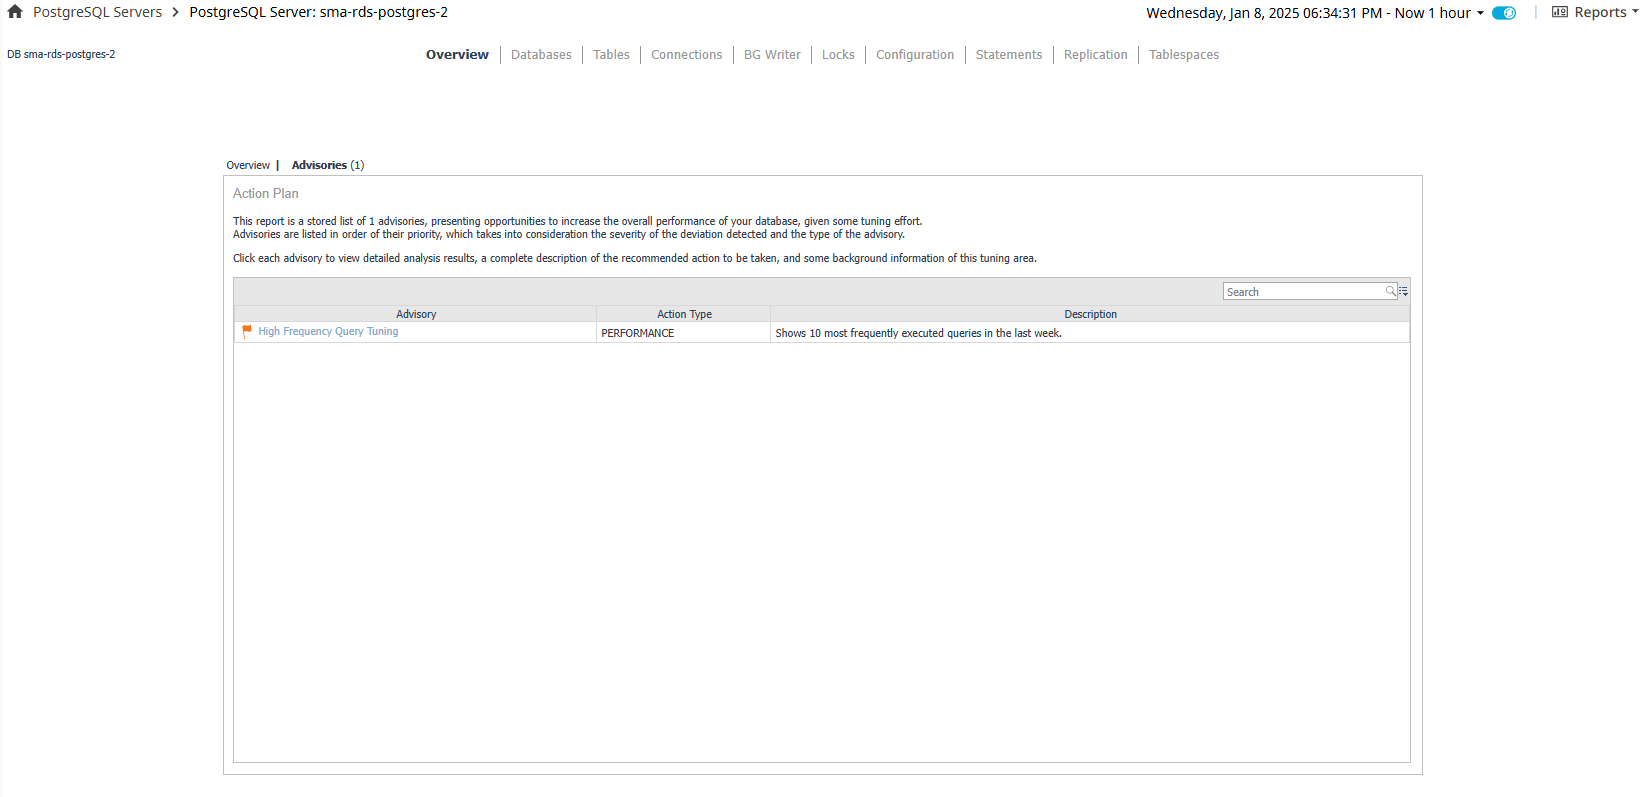
A link at the top left shows the number of active Advisories and allows switching between the Overview and Advisories pages. Clicking on any of the listed Advisories will launch a popup of the full Advisory, which contains information and advice on improving the performance, security, or other aspects of the monitored server.