Indexes
Overview
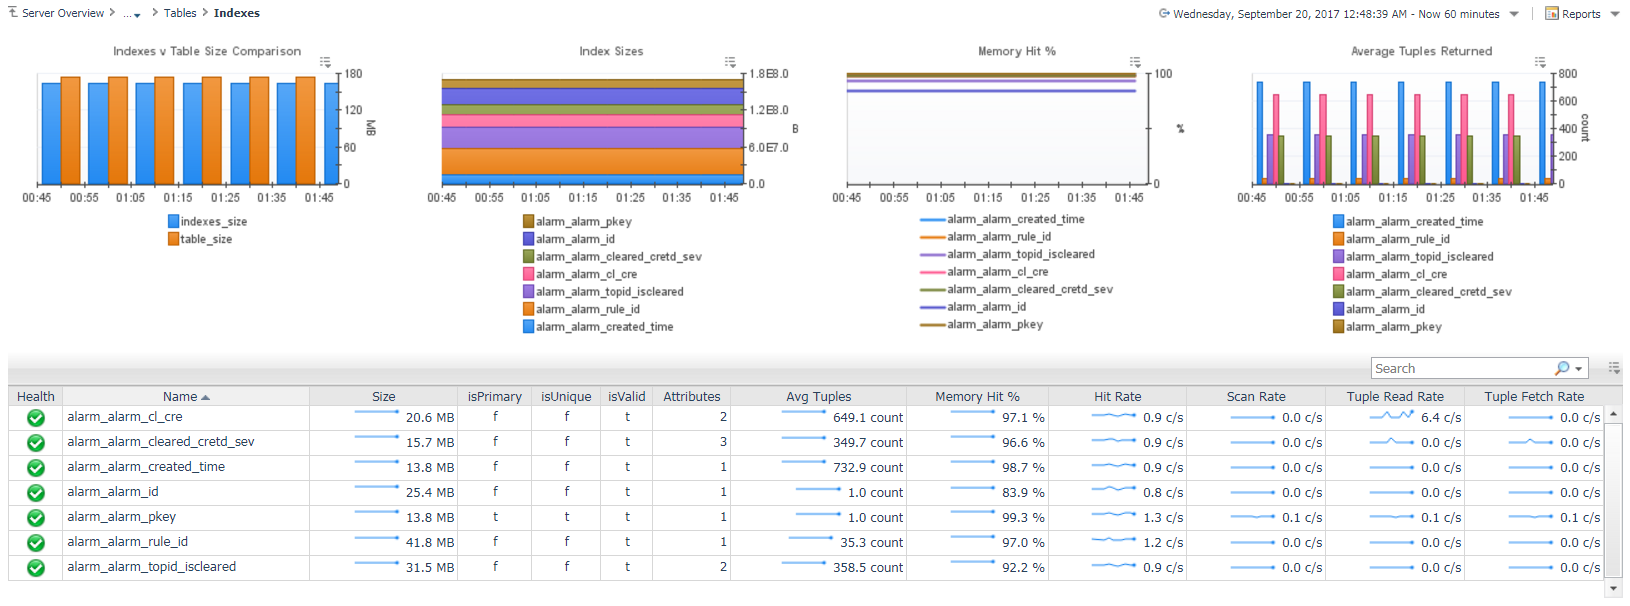
The Indexes page displays key information on indexes for the selected database table and provides comparisons between multiple table indexes in the four graphs at the top of the page. To access the Indexes dashboard, go to the PostgreSQL Server dashboard and click Tables. On the Tables dashboard, in Select Databases table click the required index under the Indexes column.
Data
Top Section – Index Comparisons
- Indexes v Table Size Comparison – Compares disk size of table vs. combined table indexes.
- Index sizes – Compares disk sizes of table indexes.
- Memory Hit % - Compares memory hit percentage of indexes.
- Average Tuples Returned – Average number of tuples returned per query.
Bottom Section – Index Table
- Health – Shows the overall health of the index.
- Name – The name of the index.
- Size – Disk size of the index.
- isPrimary – Whether index is the primary index in the table.
- isUnique – Whether index values must be unique.
- isValid – Whether index is configured correctly and can be used as an index.
- Attributes – The number of columns used in the index.
- Avg Tuples – Average number of tuples returned from an index scan.
- Memory Hit % - Percentage where a read from the index is successfully sourced from buffer cache rather than needing physical disk I/O.
- Hit Rate – Rate of buffer hits in this index.
- Scan Rate – Rate of index scans initiated on the index.
- Tuple Read Rate – Number of index entries returned by scans on the index.
- Tuple Fetch Rate – Number of live table rows fetched by simple index scans using the index.
Actions
Index Table
- Health (dwell or drilldown) - Shows a breakdown of child objects in a warning, critical, or fatal state.
- Size (dwell) - A popup time plot of the index size.
- Attributes (dwell) – A popup table of the columns used in the index.
- Avg Tuples – A popup time plot of the average number of tuples returned.
- Memory Hit % - A popup time plot of the memory hit percentage.
- Hit Rate – A popup time plot of the hit rate.
- Scan Rate – A popup time plot of the scan rate.
- Tuple Read Rate – A popup time plot of the tuple read rate.
- Tuple Fetch Rate – A popup time plot of the tuple fetch rate.