Databases
Overview
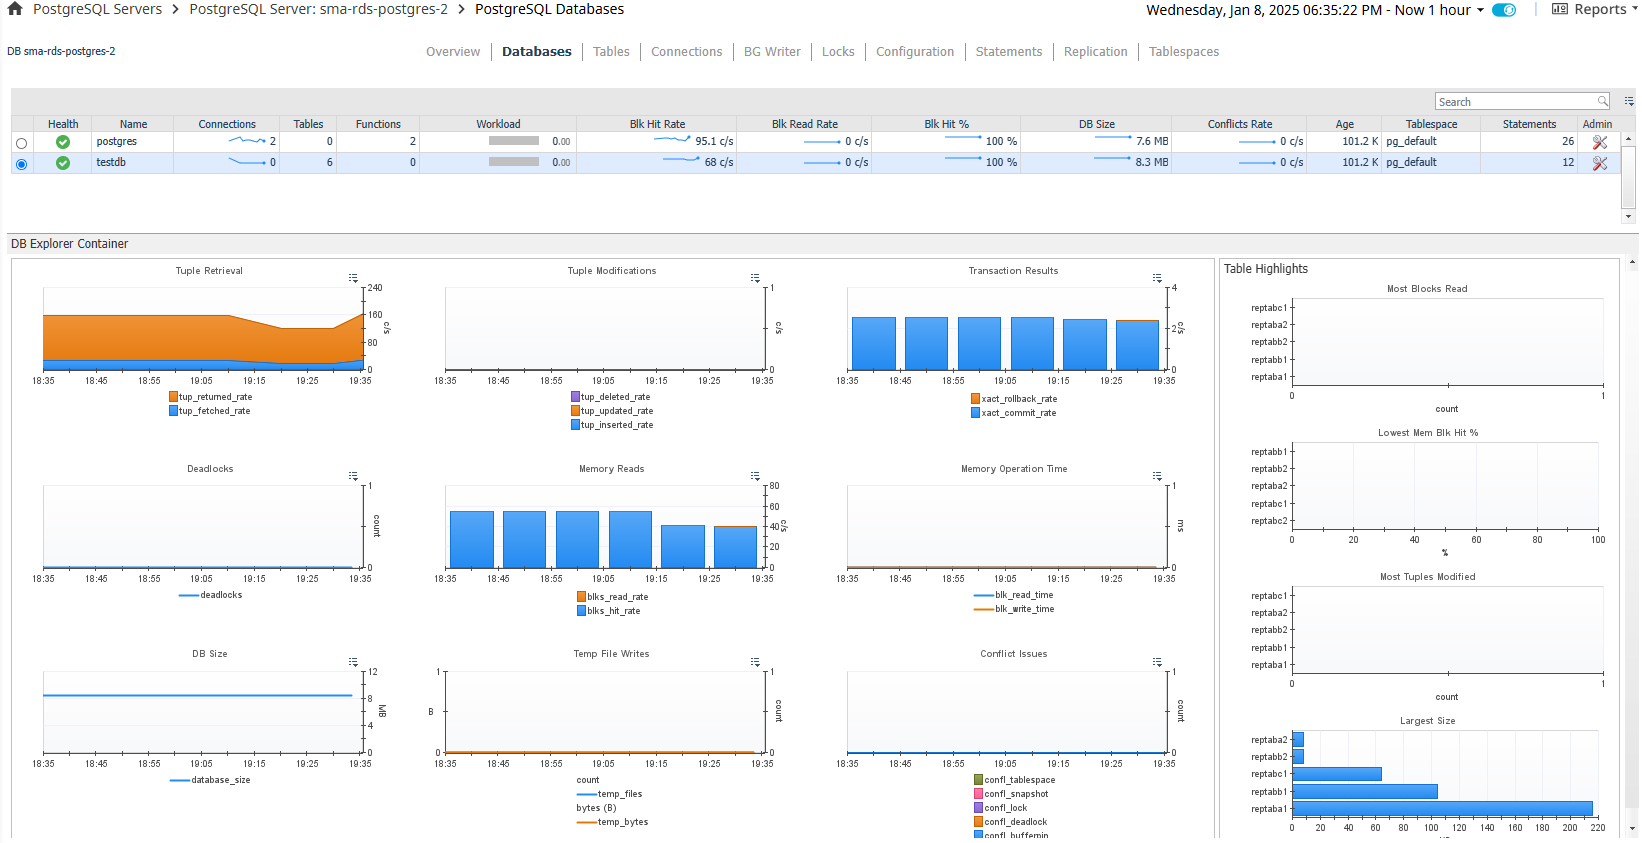
The Databases dashboard contains 2 sections separated by a horizontal splitter: the top section, which displays a row for each database as well as some key information, and the bottom section, which displays metric information related to the database selected in the top section as well as highlighting tables in that database with the highest or lowest value for a particular metric. The size of the two sections can be increased or decreased by dragging the horizontal splitter bar up or down. In the action panel on the right pane, the PostgreSQL Agent Selector allows you to switch between PostgreSQL servers.
Data
Top Section – DB Table
- Health – Shows the overall health of the database.
- Name – The name of the database.
- Connections – Number of connections to this database.
- Tables – Number of tables in the database.
- Functions – Number of functions in the database.
- Workload – A calculation of time spent reading and writing data file blocks by backends in this database in a sample period, divided by the sample period time. This represents the load on the server and may exceed 1 because of concurrent processing. This is not an estimation of resource usage or availability. Requires track_io_timing to be enabled, available only in v9.2+.
- Blk Hit Rate – Rate at which disk blocks are found already in the buffer cache, so that a read was not necessary.
- Blk Read Rate – Rate at which disk blocks are read from the database.
- Blk Hit % - Percentage where a table read is successfully sourced from buffer cache rather than needing physical disk I/O.
- DB Size – Disk size of this database.
- Conflicts Rate – Rate of queries cancelled due to conflicts with recovery in this database.
- Tablespace – Name of the default tablespace for objects created in this database.
- Statements – The number of statements gathered in the last sample for this database. This collection may be limited due to the # of Top Statements property in the Agent Properties or the pg_stat_statements.max setting on the PostgreSQL server.
Bottom Section – DB Metrics
- Tuple Retrieval – Rate of tuples retrieved with sequential scans (tup_returned_rate) vs. bitmap or simple scans (tup_fetched_rate).
- Tuple Modifications – Rate of tuples modified by deletion, update, or insert operations.
- Transaction Results – Rate of transactions finished with commits or rollback.
- Deadlocks – Number of deadlocks detected in the database.
- Memory Reads – Rate of memory blocks read from buffer cache vs. physical disk.
- Memory Operation Time – Time spent reading or writing data file blocks by backends.
- DB Size – Disk size of the database.
- Temp File Writes – Number of temporary files created by queries in this database and the total data size.
- Conflict Issues – Breakdown of cancelled queries due to conflict by reason.
Bottom Section – Table Highlights
- Most Blocks Read – Tables with the most disk blocks read during queries.
- Lowest Mem Blk Hit % - Tables with the lowest memory block hit %, i.e. tables where data is being read from disk rather than buffer cache.
- Most Tuples Modified – Tables most actively being modified.
- Largest Size – Tables with the largest disk size.
Actions
Database Table
- Health (dwell or drilldown) - Shows a breakdown of child objects in a warning, critical, or fatal state.
- Connections
- Dwell - A popup time plot of connections.
- Drilldown – Navigates to the Current Backends page filtered for selected database.
- Tables (drilldown) – Navigates to the Tables page for the selected database.
- Functions (drilldown) – Navigates to the Functions page for the selected database.
- Blk Hit Rate (dwell) – A popup time plot of the block hit rate.
- Blk Read Rate (dwell) – A popup time plot of the block read rate.
- Blk Hit % (dwell) – A popup time plot of the block hit percentage.
- DB Size (dwell) – A popup time plot of the database size.
- Conflicts Rate (dwell) – A popup time plot of the conflicts rate.
- Tablespace
- Dwell - A popup table with the tablespace’s health, OI, owner, and disk size.
- Drilldown – Navigates to the Tablespaces page.
- Statements (drilldown) – Navigates to the Statements dashboard, filtered for statements only performed on the selected database.
Table Highlights
Clicking on an area of the graph reserved for displaying the metric value for a table will drilldown to the Tables page for that database with the selected table highlighted.
Admin Actions
If your user account has the PostgreSQL Administrator role and the PostgreSQL user provided to the agent has the appropriate permissions, you can perform administrative actions on the server from the dashboard. Click the icon in the Admin table column to perform one of the following actions:
- Vacuum + Analyze – Perform a VACUUM ANALYZE operation on the database.
- Vacuum – Perform a VACUUM operation on the database.
- Analyze – Perform an ANALYZE operation on the database.
- Stat Reset – Reset the statistic counts on the database.