Current Locks
Overview
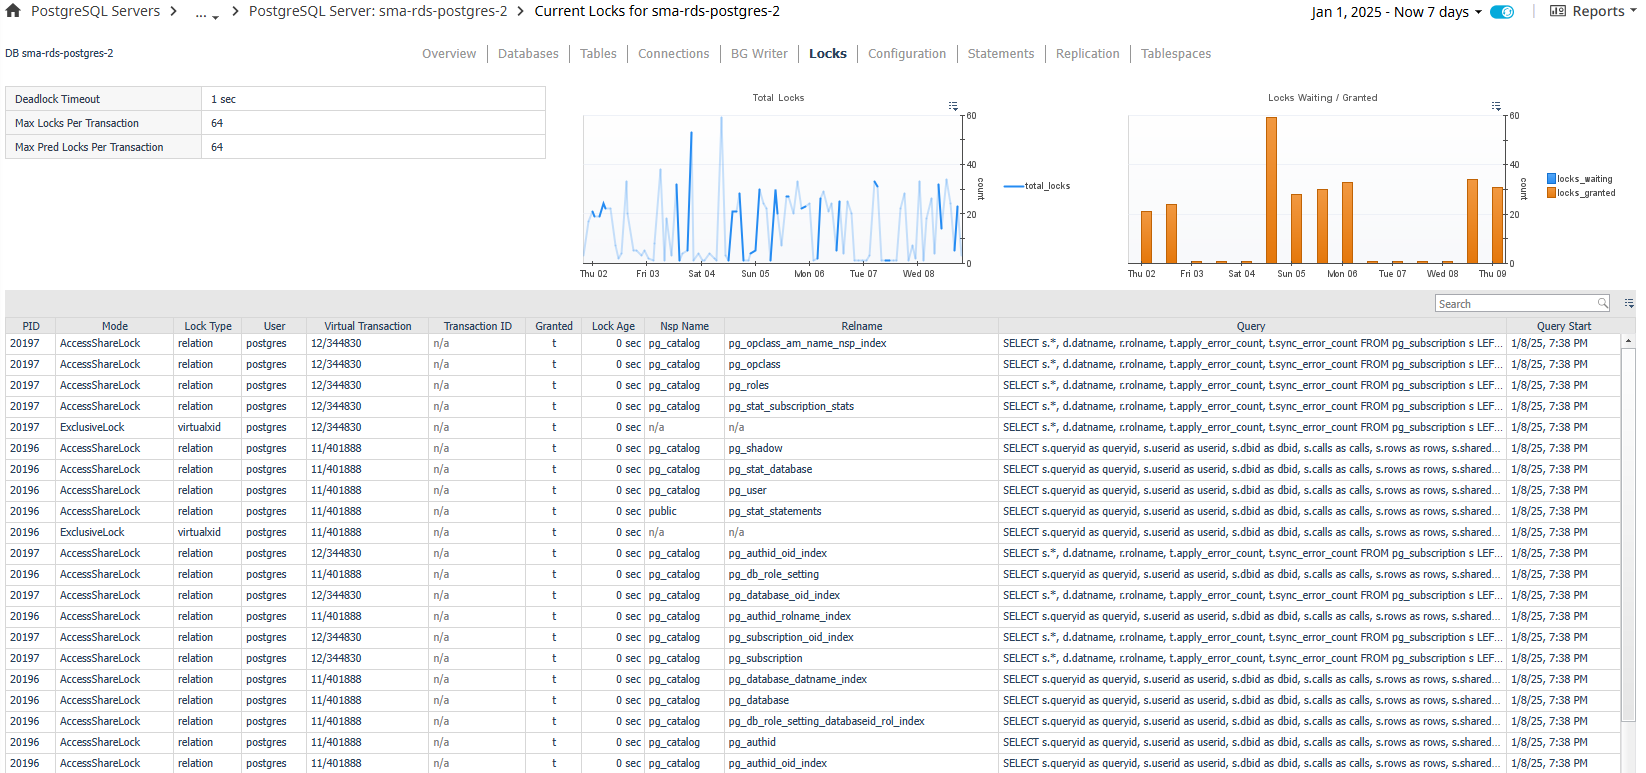
The Current Locks page shows current locks in the server from the last server data sample and related information. In the action panel on the right pane, the PostgreSQL Agent Selector allows you to switch between PostgreSQL servers.
Data
Top-left Table Section
- Deadlock Timeout – The amount of time that the server waits on a lock before checking to see if there is a deadlock condition.
- Max Locks Per Transaction – The average number of object locks allocated for each transaction. Individual transactions can lock an infinite amount of objects, but as a whole, the server cannot allow an average of more than this number across all active transactions.
- Max Pred Locks Per Transaction - The average number of predicate locks allocated for each transaction. Individual transactions can lock an infinite amount of objects, but as a whole, the server cannot allow an average of more than this number across all active transactions.
Top Graphs
- Total Locks – Total locks on the server.
- Locks Waiting/Granted – Shows number of locks waiting and granted.
Table
- PID – Process ID of the lock.
- Mode – Name of the lock mode held or desired by the process.
- Lock Type – Type of the lockable object.
- User – User controlling the backend that requested the lock.
- Virtual Transaction – Virtual ID of the transaction.
- Transaction ID – ID of the transaction targeted by the lock or null if target is not a transaction.
- Granted – True if lock is held, false if it is waiting to be granted.
- Lock Age – How long since lock process started.
- Nsp Name – Name of the namespace.
- Relname – Name of the object targeted by the lock.
- Query – Current or last query executed by the backend. Shown in an abbreviated state in order to fit in the table cell.
- Query Start – Time when the currently active query was started or start of the last query if not active.
Actions
- Query (dwell or drilldown) - Shows the full query text in a formatted, colored state for better readability.