Configuring PostgreSQL Performance Investigator (PI)
PostgreSQL PI in Foglight serves the primary function of providing comprehensive monitoring and performance analysis capabilities for PostgreSQL database environments. It continuously monitors various performance metrics of PostgreSQL databases in near real-time (every 1 min). It collects data on metrics such as wait statistics, memory utilization, disk I/O, query execution times, and more. For PostgresSQL PI to function properly, configurations on monitored PostgreSQL instances are necessary.
Prerequisites for Monitoring PostgreSQL with the PI Agent
Prerequisites to monitor PostgreSQL PI:
Install a PostgreSQL agent from the Databases dashboard. For more information, refer to Ease of Installation
Configure the track_activities parameter. It enables the collection of information on the currently executing command of each session, along with its identifier and the time when that command began execution. It is ON by default in most of the PostgreSQL versions. It can be configured in postgresql.conf by editing config file or by SET command:
- config file: track_activities = on
- command: SET track_activities to on
After parameter is set, PostgreSQL service should be restarted.
Configure the track_activity_query_size parameter that specifies the amount of memory reserved for storing the text of the currently executing command for each active session.
After parameter is set, PostgreSQL service should be restarted.If this value is specified without units, it is taken as bytes. The default value is 1024 bytes (1kb) and maximum value is 1048576 bytes (1MB). Recommended is 4096 bytes (4kb). It can be configured only by editing config file postgresql.conf: track_activity_query_size = 4096.
Enabling PostgreSQL PI for an Agent
To enable PostgreSQL PI for an agent:
- Click Databases in the left navigation pane.
- On the Databases page, click on the PostgreSQL tile. The page displays a list of agent names along with their SQL PI activation status under the Monitoring Agent column.
- Click Enable PI for the agent you want to activate PI. The Administration page for SQL Performance Investigator appears.
- Click the checkbox against the agent name, and then click Enable.
Prerequisites for Using PostgreSQL PI Execution Plan
Prerequisites for using the PostgreSQL PI execution plan:
- Navigate to Administration > Agent > Agent Status dashboard in the left pane. A list of agents is displayed.
- Select the required PostgreSQL Agent from the list and click Edit Properties.
When you configure PostgreSQL PI in Foglight, it creates two types of agents: PostgreSQL PI Agent and PostgreSQL Agent. To view the execution plan, select the appropriate PostgreSQL Agent.
- On the Edit Properties page, under Administration section, ensure that the checkboxes of the following options are selected:
- Enabled Administration
- Enable Explain Plans
- Enable Explain Analyze
Enter the Admin User name and Admin Password.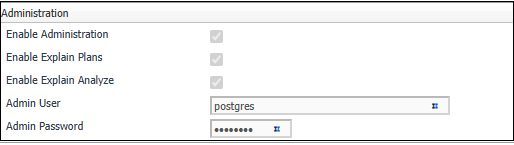
Once the prerequisites are set, you can view the execution plan. For more information refer to Viewing Execution Plans.