Tables
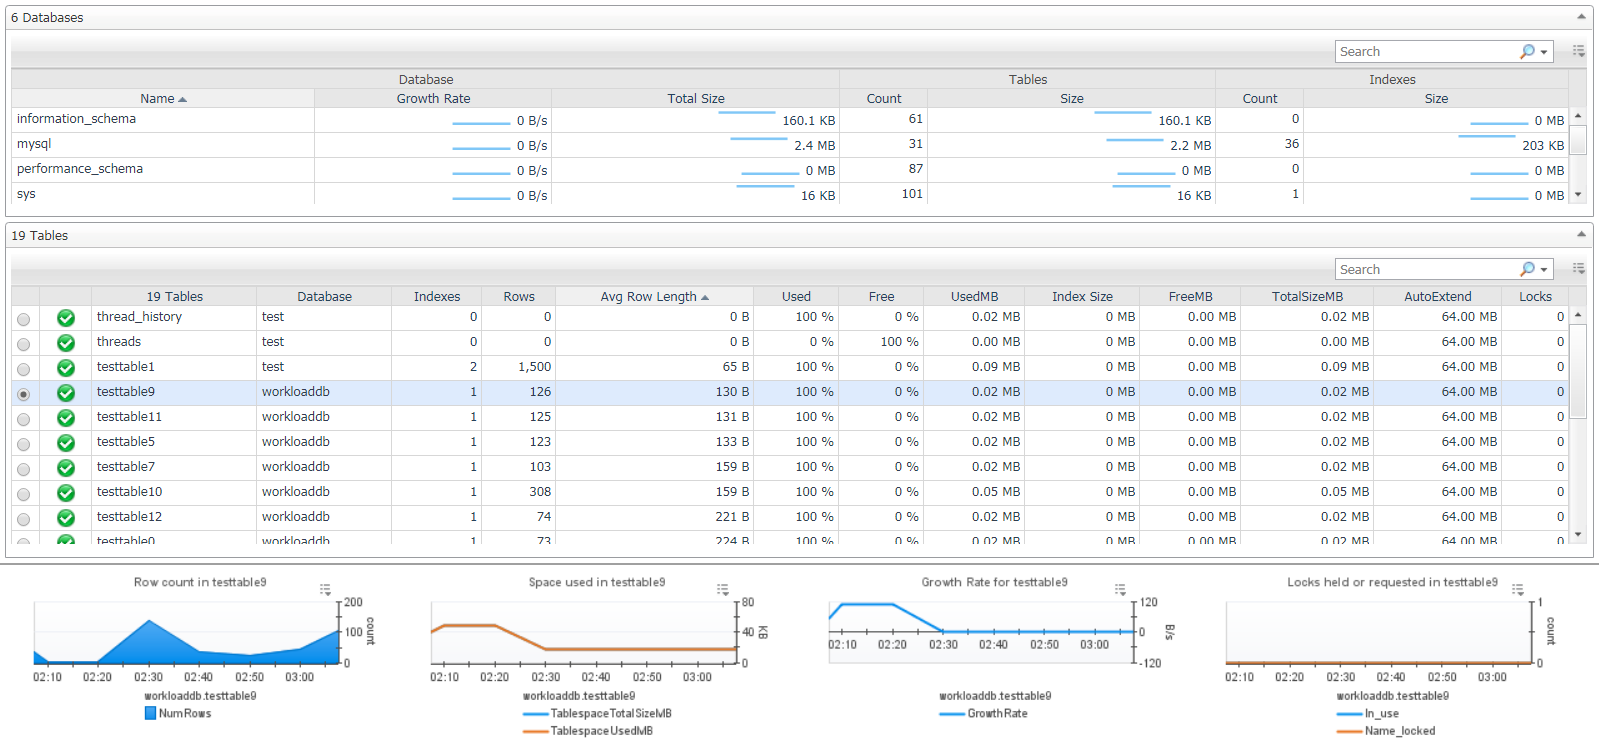
The Tables dashboard displays detailed table information for the monitored MySQL instance. If Basic Table Monitoring is enabled in the agent properties, a simplified version of the dashboard appears, allowing navigation between different collection samples.
The Databases table aggregates metrics for tables in each database, including growth rate, table counts, index counts, and sizes. The Tables table provides detailed information for each monitored table, such as health status, sizing data, and configuration details. Selecting a table updates the section below to display historical metrics for that table, including sizing trends, growth rates, and lock counts.


