Statements
The MySQL Statement Digests dashboard supports MySQL 5.6.5+ servers with the performance_schema engine enabled. Statement digests normalize statements that share the same operation plan. Even when statement values differ, the server performs the same operations, allowing aggregation for analysis. The agent collects these digests along with raw and calculated statistical data and sends them to Foglight.
If MySQL PI is enabled for this instance, Statement collection in the MySQL Agent Properties will be disabled by default and this page will be replaced with the MySQL PI dashboards instead.
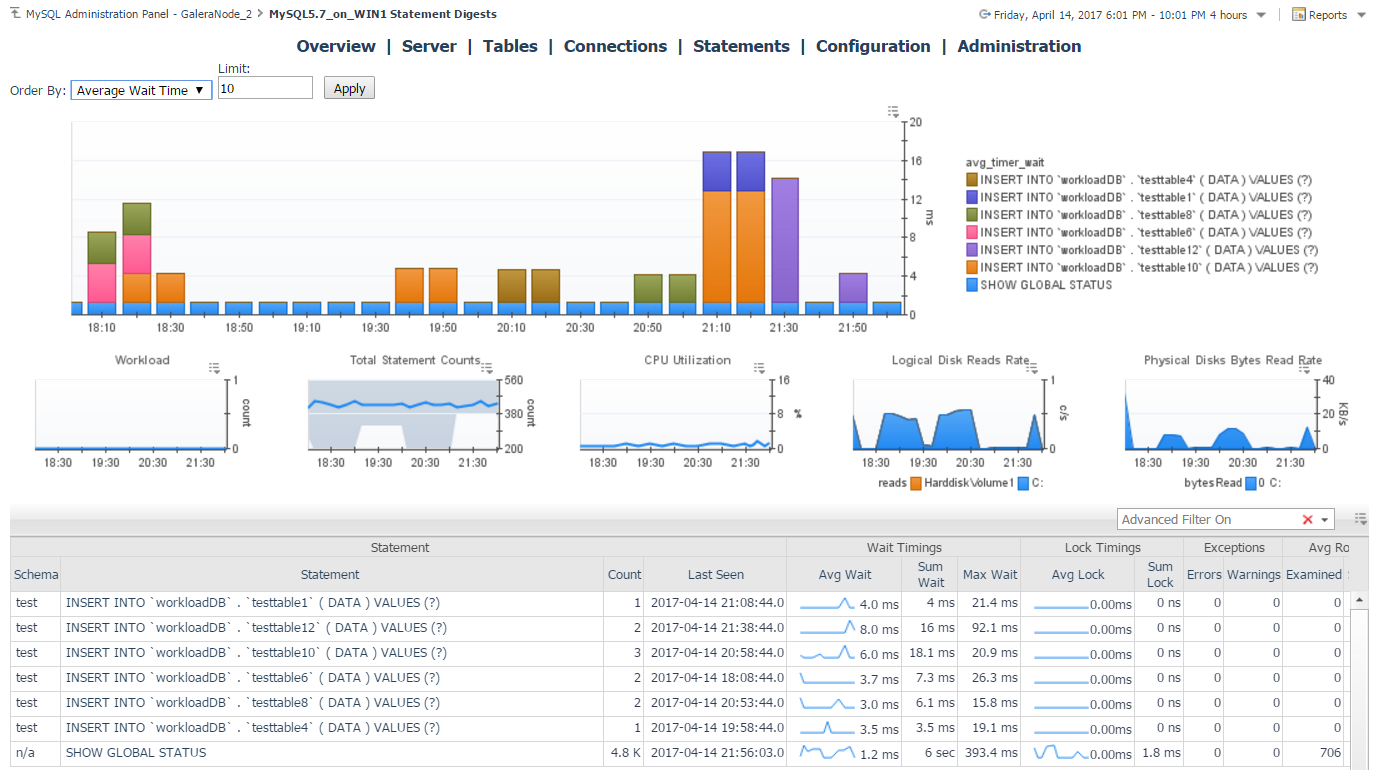
The main time plot displays the top X statements based on a metric selected from the dropdown menu. Below the time plot, additional graphs correlate with statement performance to help identify their impact on the system.
A table below these graphs lists all statement digests collected from the server. The number of statement digests maintained by the server depends on the version and the value of performance_schema_digests_size. If the number of digests exceeds this limit, excess statements are grouped into a single digest, which is also collected.
The table displays period values for the selected time range for all statistics, except for First/Last Seen and Min/Max Wait Time, which are cumulative. By default, an advanced filter excludes statements executed on system databases such as mysql, performance_schema, and information_schema. Users can disable this filter by clicking the x’ in the filter text box. Selecting a statement in the table navigates to the Statement Details page, where an expanded version of data for that statement can be viewed, along with comparison data for that statement if it has been performed on other monitored servers. Additionally, an explain plan can be requested, if the agent has been configured to allow it and the user has the required privileges to do so.


