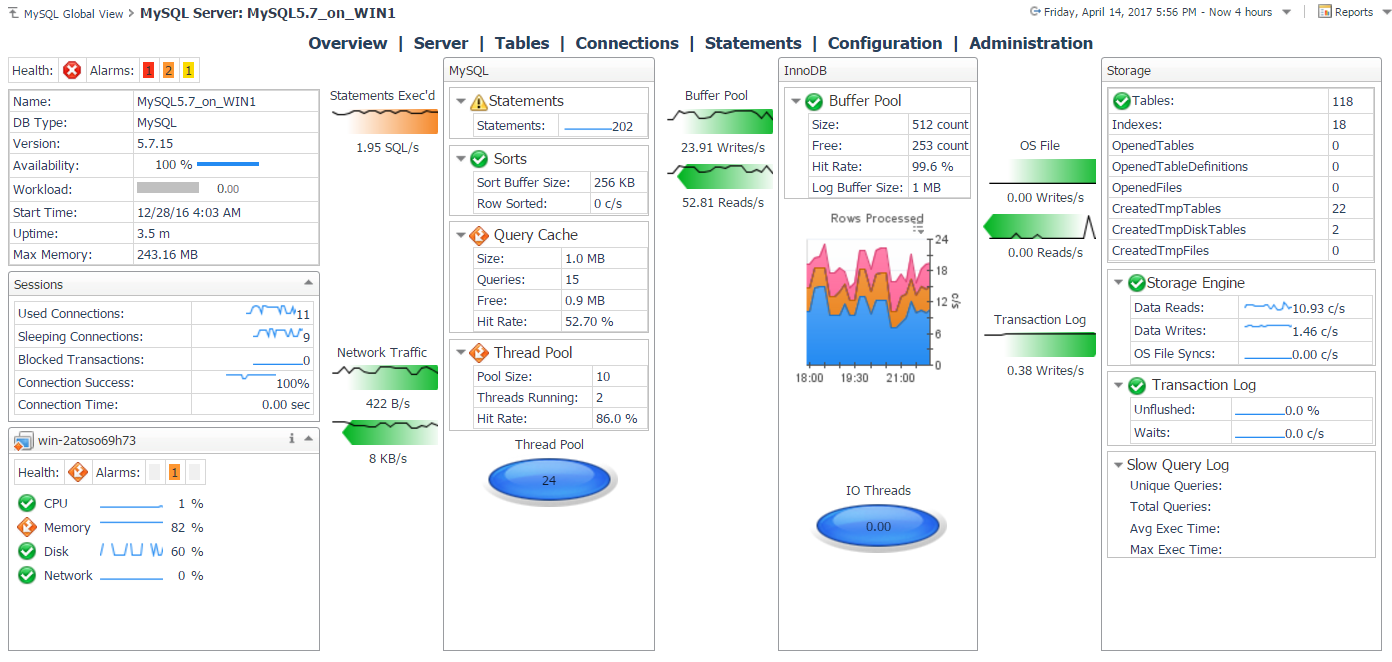
Server Overview
The dashboard provides an overview of the MySQL server, displaying availability, performance, and storage metrics. It includes an expandable summary box that shows either the top 10 SQL statements executed during the current time range by selected metrics or the top 10 active alarms for the server. SQL statements can be sorted by selecting metrics from the dropdown menu.
A link at the top left displays the number of active Advisories and allows you to switch between the Overview and Advisories pages. Selecting an Advisory opens a popup with detailed information and recommendations for improving the performance, security, or other aspects of the monitored server.


