Galera Node
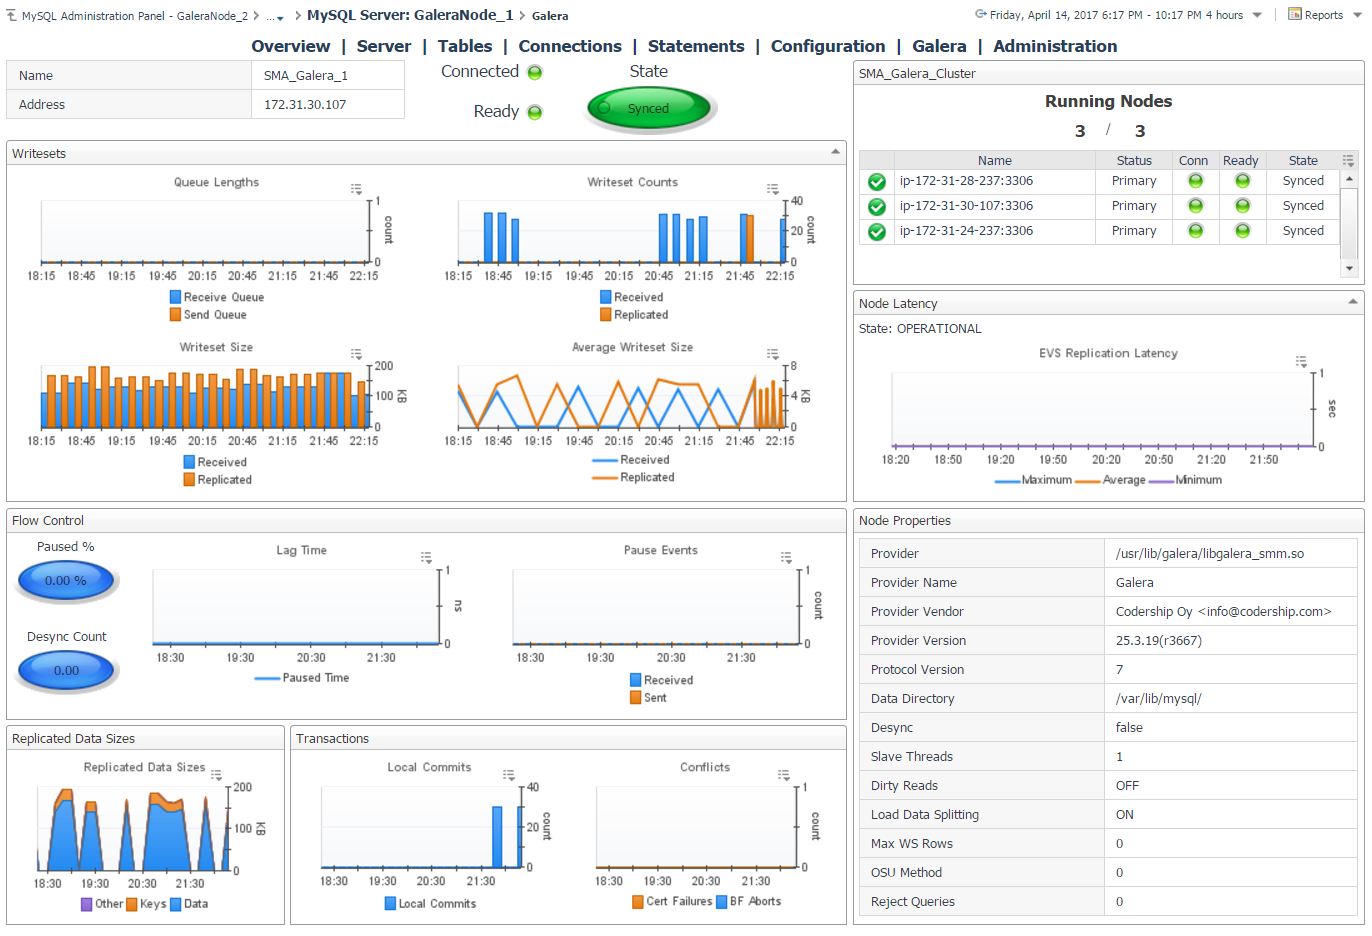
The Galera Node dashboard displays Galera-related information for a MySQL server configured as a Galera node. It displays the current status of the Galera node and provides relevant server variables, as well as informational and performance metrics for writesets, flow control, latency, transactions, and replicated data size.
It also displays a summary of the Galera cluster to which the node belongs, including the number of collected and monitored nodes and a list of each node with their current states. Selecting a different node name updates the page to show information for the selected node.


