Viewing Dashboards
The Foglight for MongoDB cartridge provides the following top-level views: MongoDB Servers, Replica Sets, and MongoDB Clusters. To access these views navigate to Databases > MongoDB in the left navigation pane.
This cartridge includes the following main dashboards:
- MongoDB Servers
- Replica Sets
- MongoDB Clusters
- Server Overview
- Databases
- Collections
- Collection Metrics
- WiredTiger
- Operations
- Memory
- MMAPv1
- Locks
- Current Operations
- Slow Operations
- Profiled Operations
- Replication
- Log
- Users and Roles
- MongoDB Object Cleanup
MongoDB Servers
This top-level dashboard lists all monitored MongoDB Servers and contains important configuration information, alarm status, and key metrics for the server. The workload metric is used for comparing the amount of work a server is doing relative to another MongoDB server. Clicking the DB server’s name will drill down into the Server Overview dashboard. If using the Infrastructure cartridge to monitor the host, clicking or hovering on the host name will provide more information on the DB server’s host.

Replica Sets
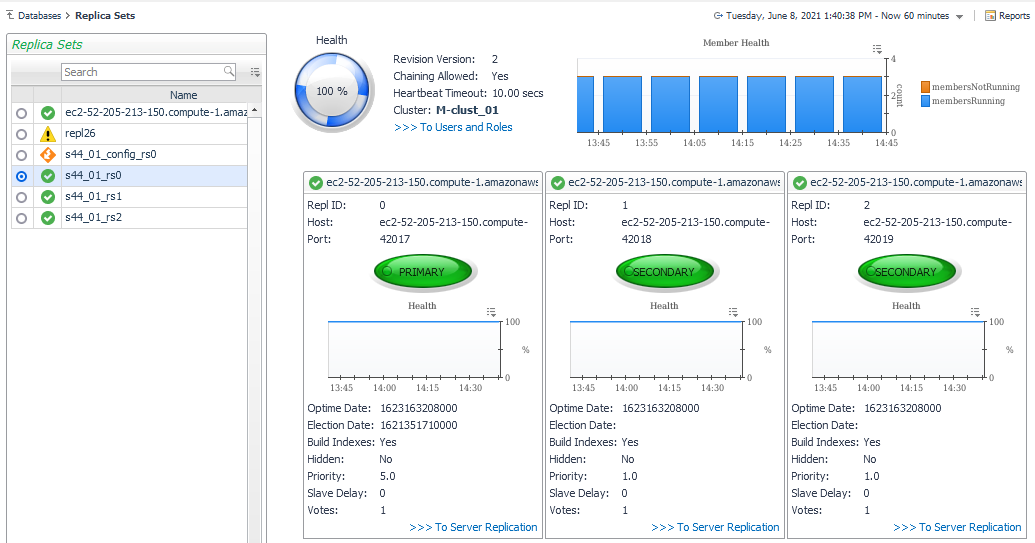
This top-level dashboard is dynamic and expands to provide a list of discovered Replica Sets. Selecting a specific Replica Set from the left-hand navigation pane automatically updates the right side of the page showing all members of the Replica Set. The Health indicator shows percentage of members currently running. The adjacent bar graph shows number of members running/not running. If the server is actively monitored by a MongoDB Agent, a link “Click for More Information” will appear, leading to the Replication page for that server, covered later in this document.
MongoDB Clusters
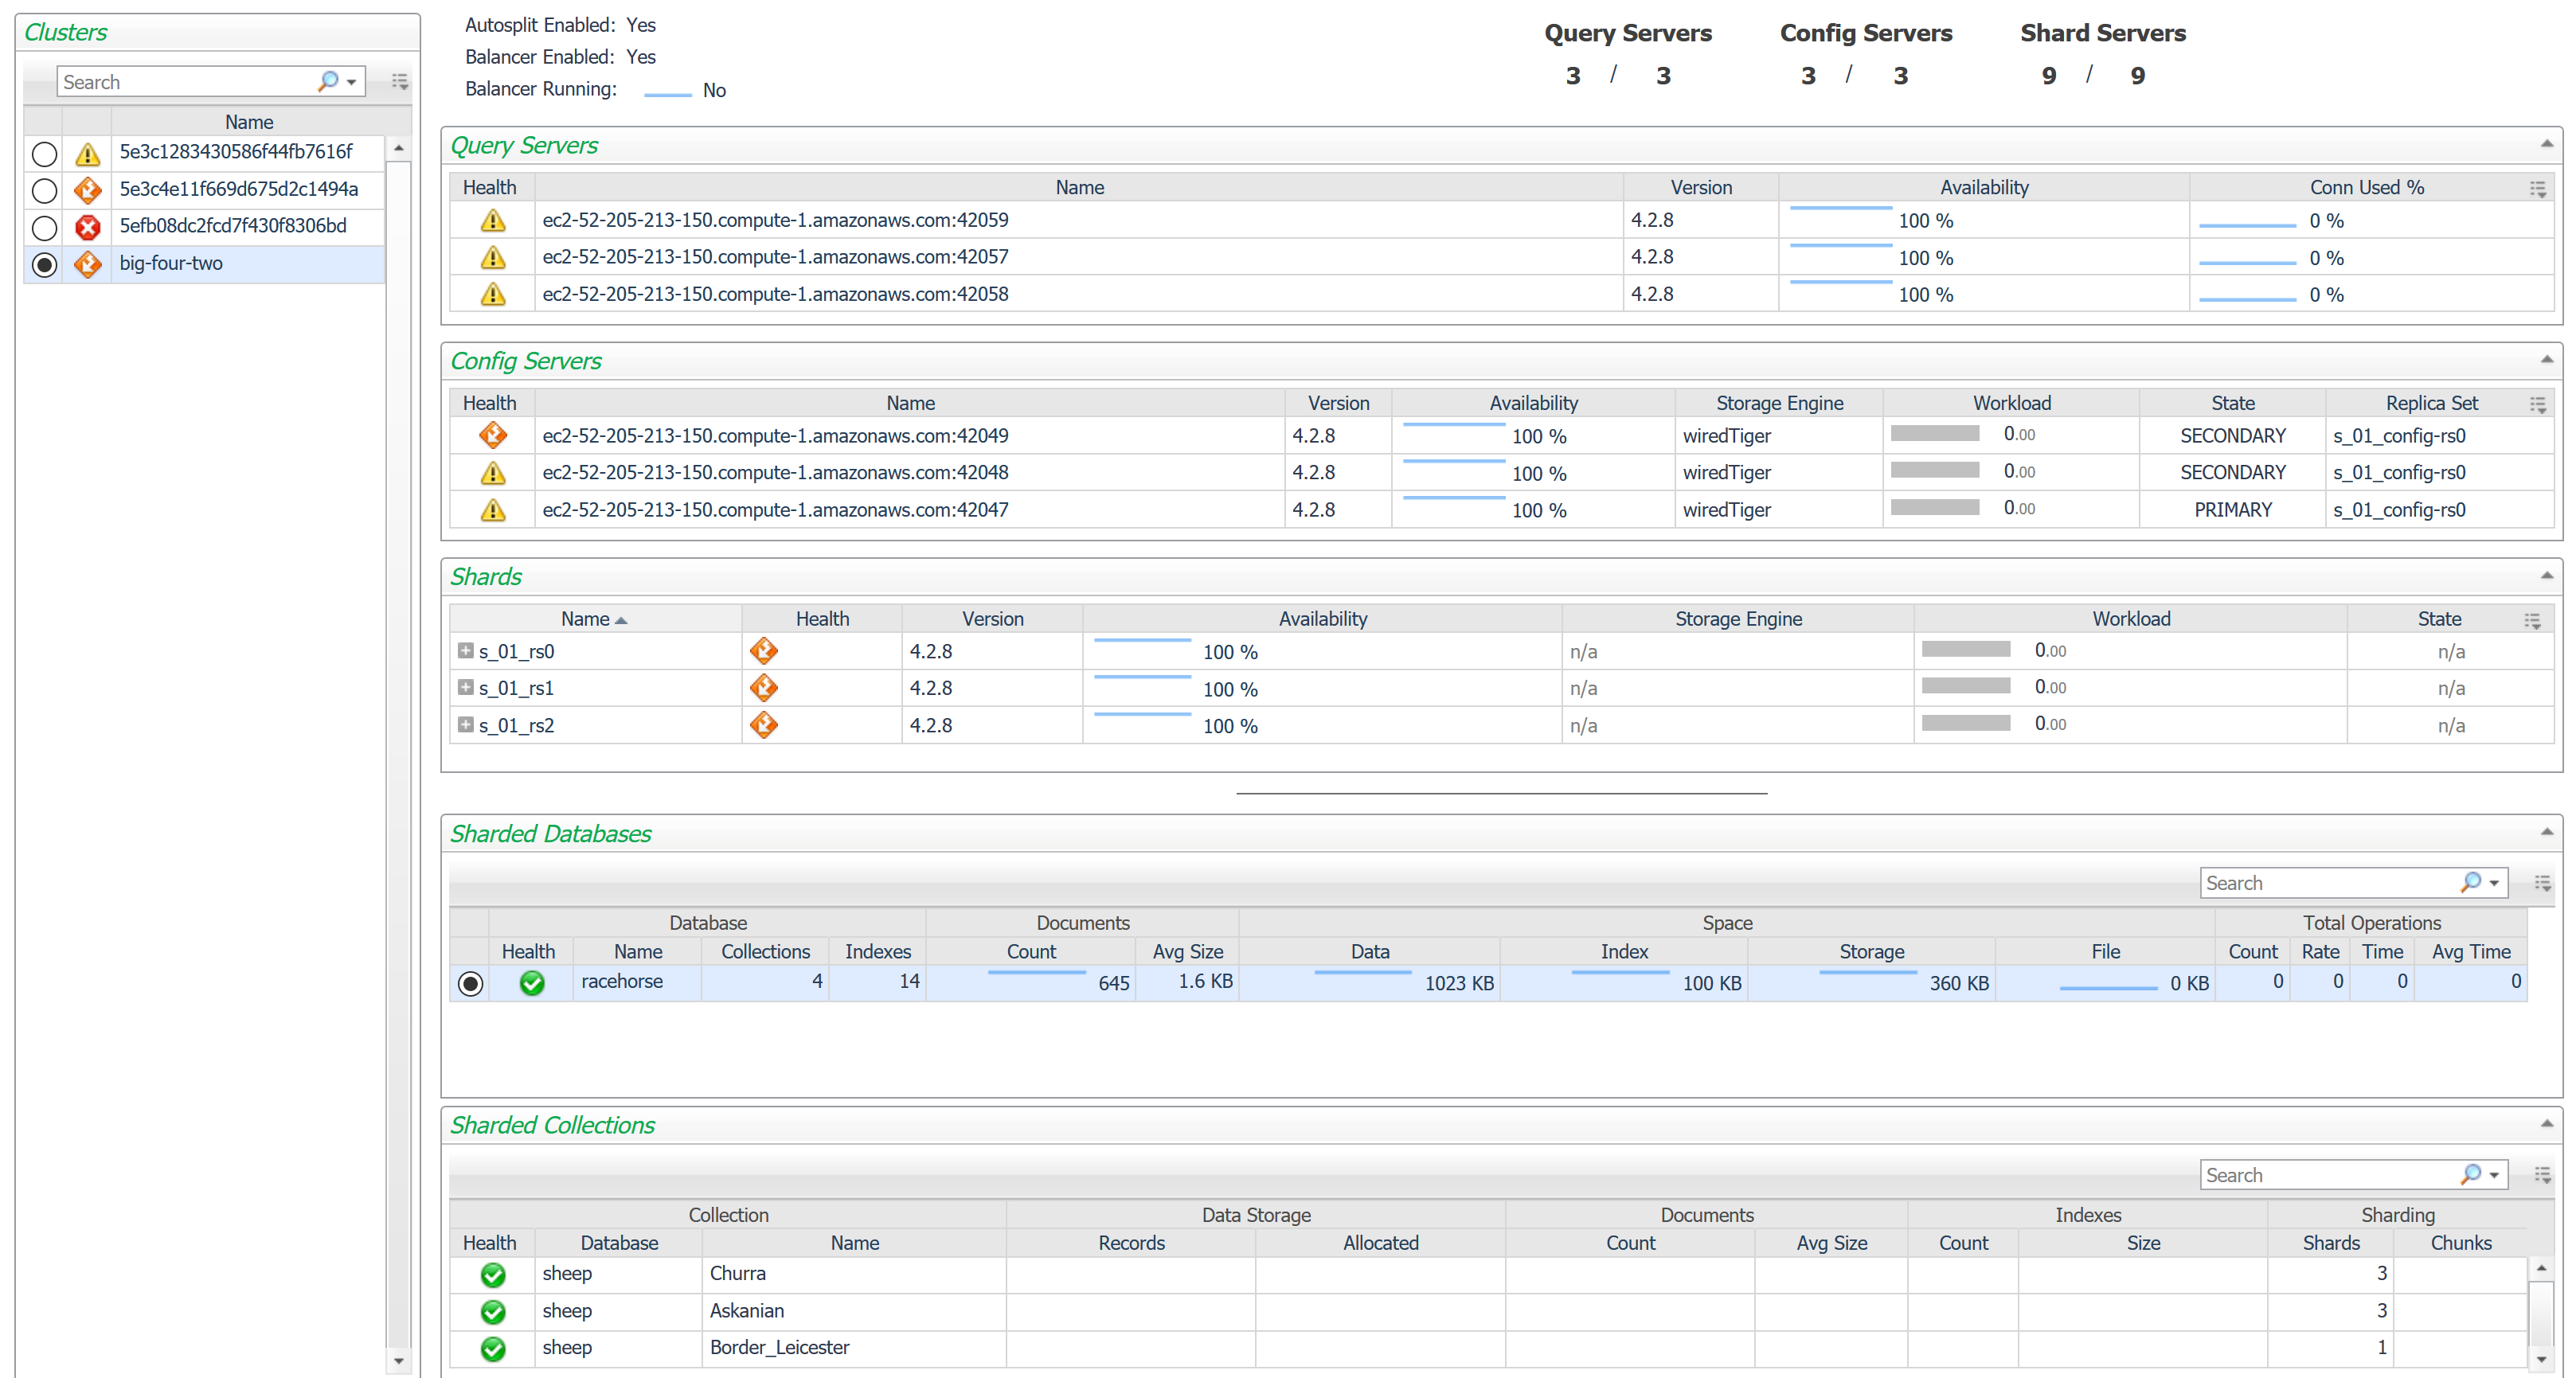
This top-level dashboard lists all monitored MongoDB clusters. Selecting a cluster updates the page with summary data on the cluster status as well as listing the different components in the cluster, including mongos, configsvr, shards, and databases and collections.
Server Overview
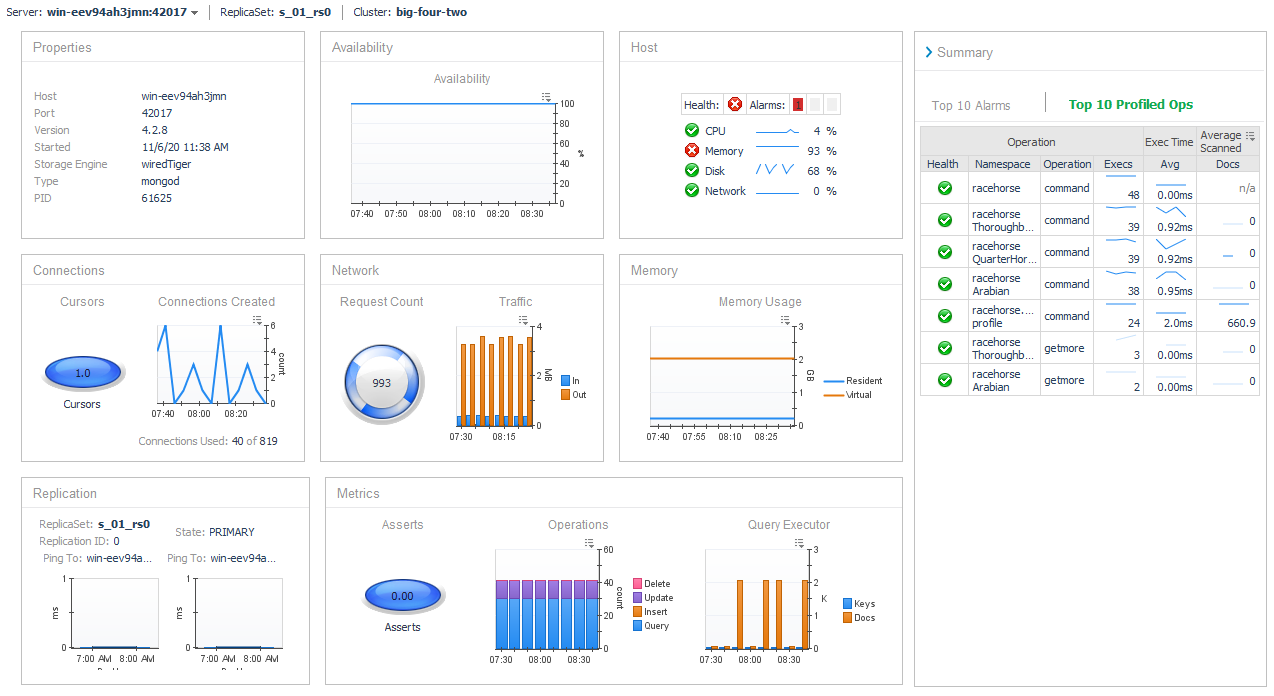
This dashboard provides a comprehensive view of the MongoDB Server, Network, and Host metrics. Operators can hover over titles and the dashboard will display the current state and any associated alarms. The Server Navigation Bar at top can be used to navigate to other pages containing more detailed information on this server. Also, the MongoDB Server Selector link in the action panel on the right of the screen exists for all pages at this level, allowing you to switch between servers without returning to the MongoDB Servers dashboard.
Databases
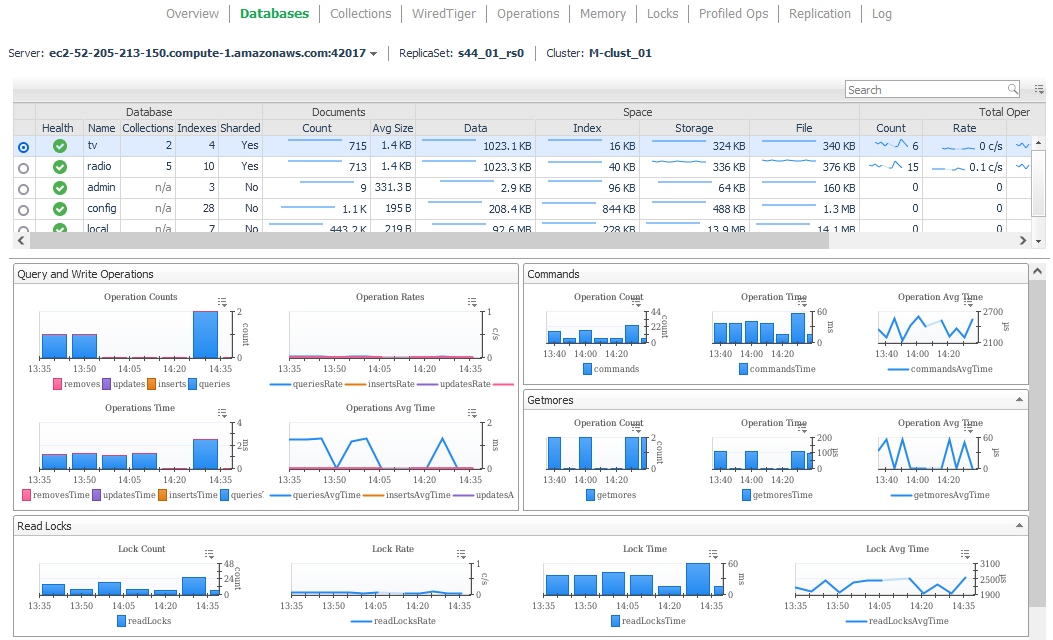
The Databases dashboard lists all non-system databases on the server, along with a variety of usage and performance information. Selecting a row updates the lower section to show operation statistics for that database. Clicking a value in the Collections column drills down to the Collections page for this server, with only the collections for the selected database row shown.
Collections
The Collections dashboard lists the largest non-system collections on the server up to the configured maximum collection count. Identifying information, size, and capped collection configuration are displayed for each. Only collections for the selected databases are shown. The Select Databases option at the top-left of the table provides the option to change which database(s) are selected. Clicking on a collection name drills down to the Collection Statistics page, discussed below.

Collection Metrics
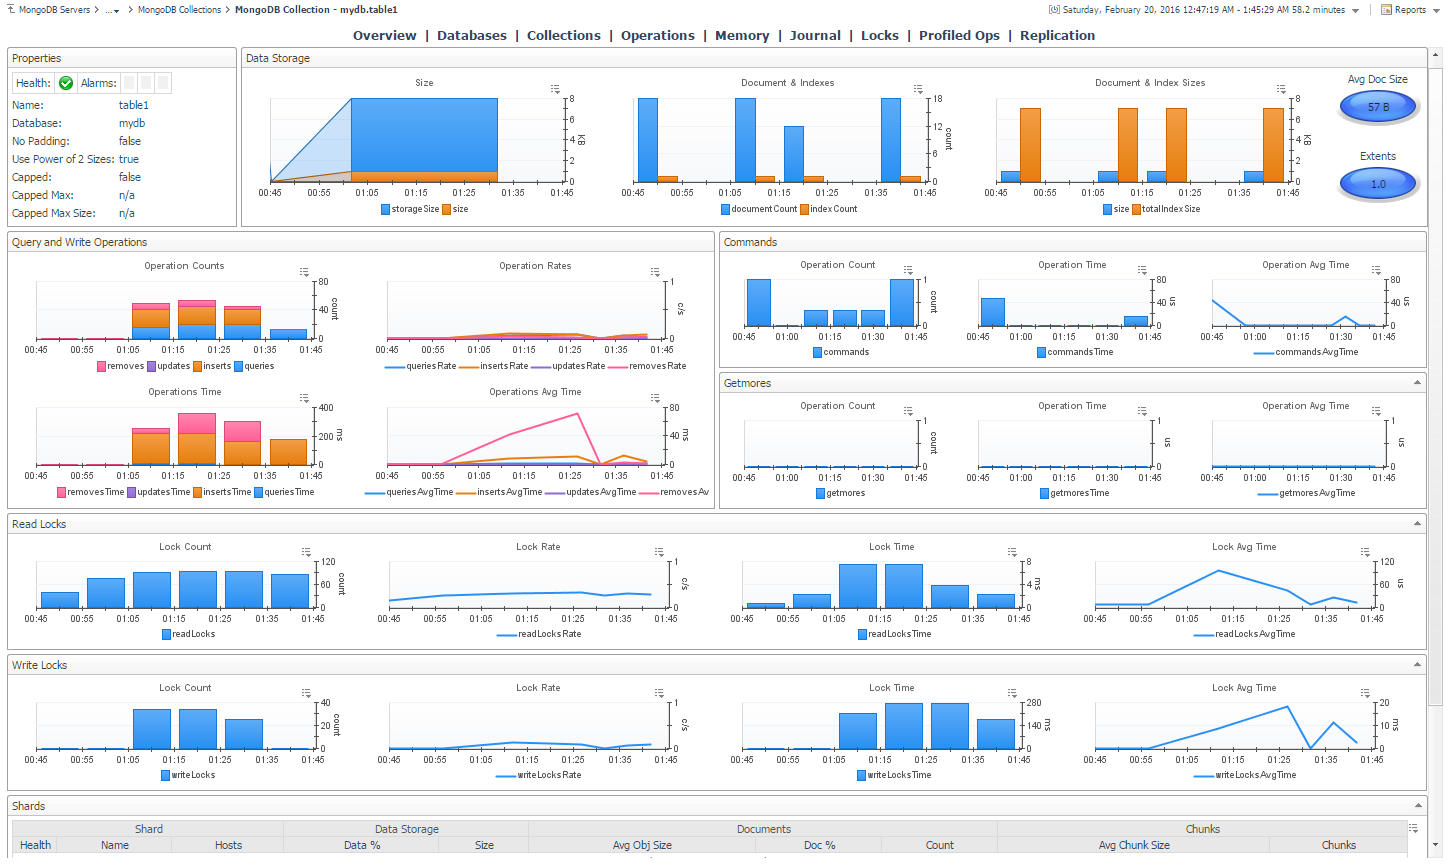
The Collection Metrics page shows all information available for a single collection. This includes configurations properties, data storage and operational metrics, along with shard statis if sharding is enabled.
WiredTiger
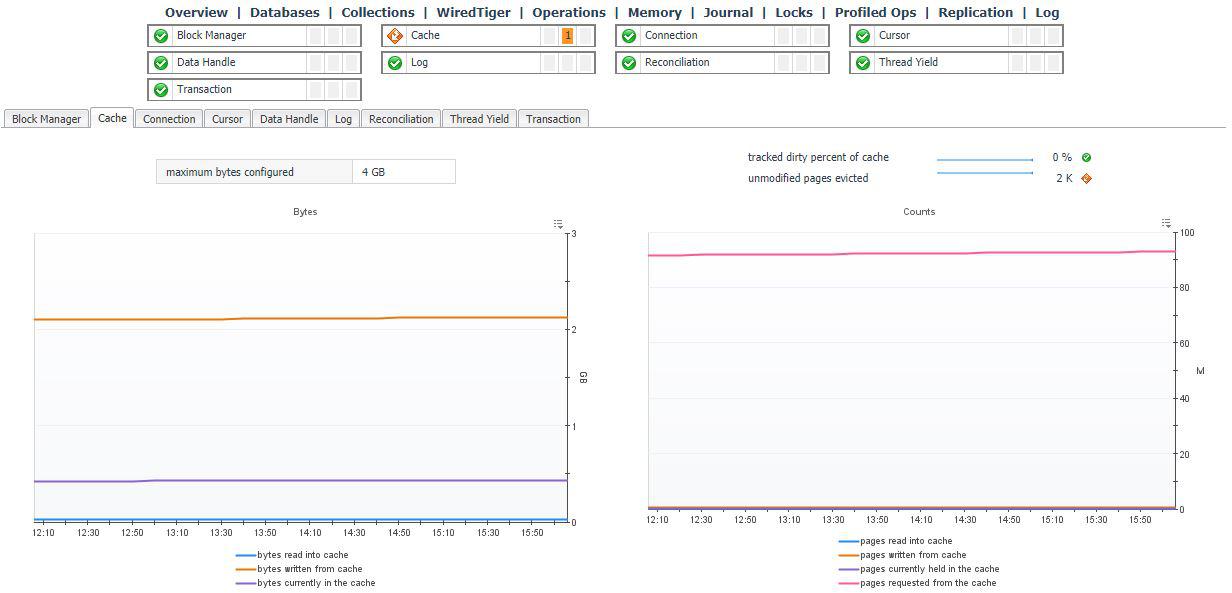
This dashboard exposes the technical inner workings of the WiredTiger storage engine. Metrics include cache size and state, transaction ticket queues, memory and IO activity, cursor and session counts, and log size and operations.
Operations
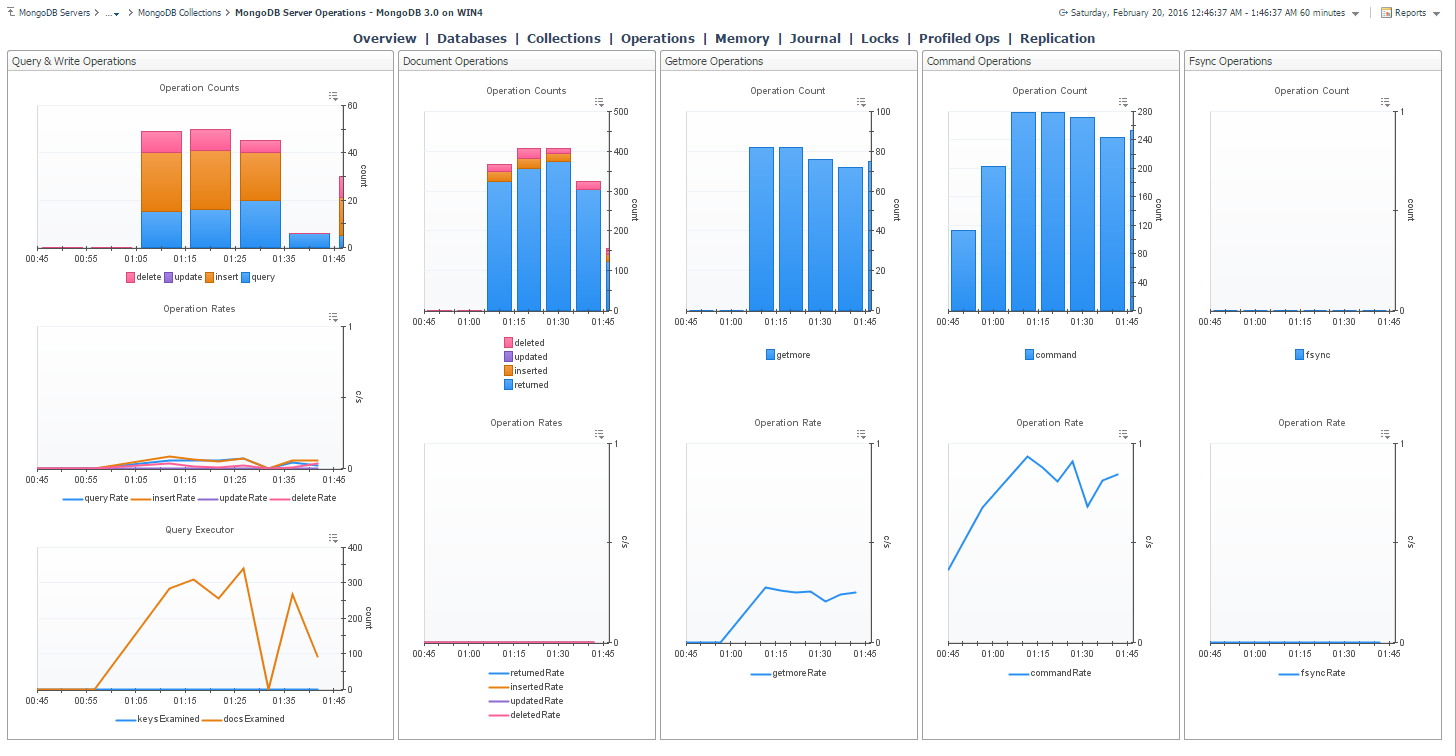
The operations dashboard updates based on the agent properties setting but can be adjusted to near-real-time monitoring and set to automatically refresh every 60 Seconds (No manual Refresh is required). The dashboard shows operations counts for Query & Write Operations, Document Operations, Getmore Operations, Command Operations, and Fsync Operations.
Memory
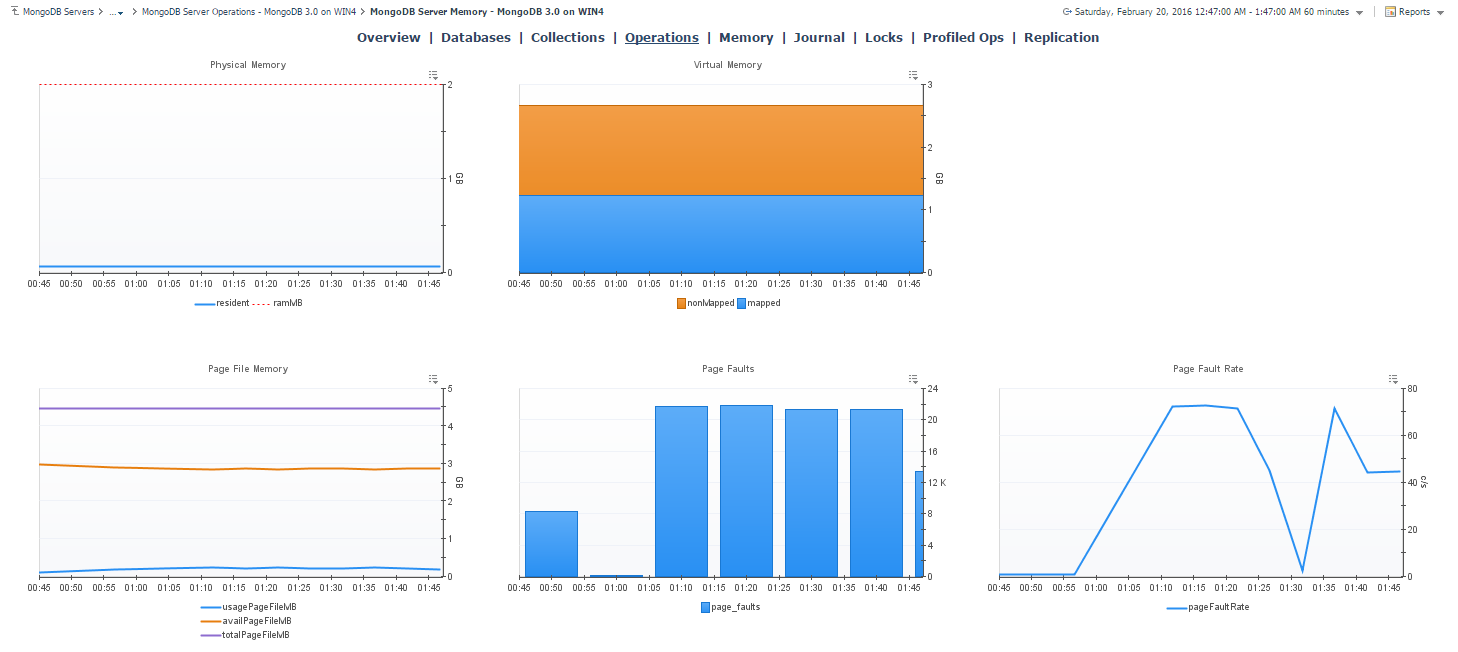
The memory dashboard displays metrics for Physical and Virtual Memory in addition to Page File Memory, and the number of Page Faults and the Page Fault Rate.
MMAPv1
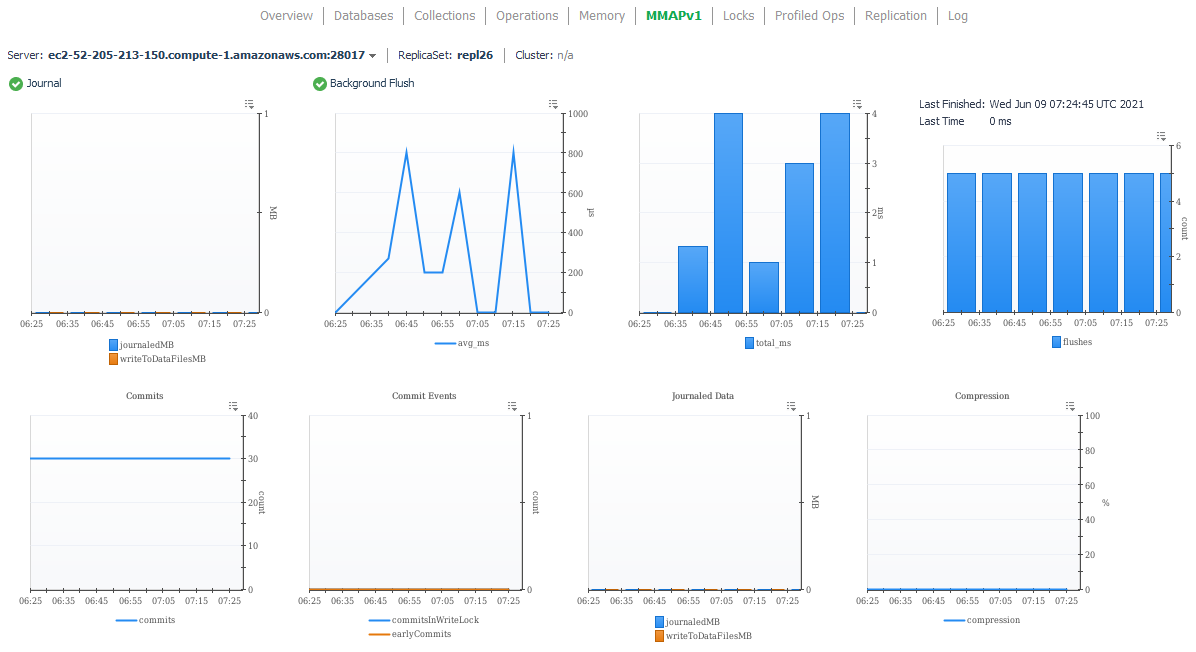
The MMAPv1 Dashboard shows the number of Background Flush, Commits, Commit Events, Journaled Data, Compression Percentage, Commit Timings and Journal Timings for the MMAPv1 journal, if it is enabled. A dashboard for monitoring the equivalent WiredTiger feature can be found in the Log tab on the WiredTiger dashboard.
Locks
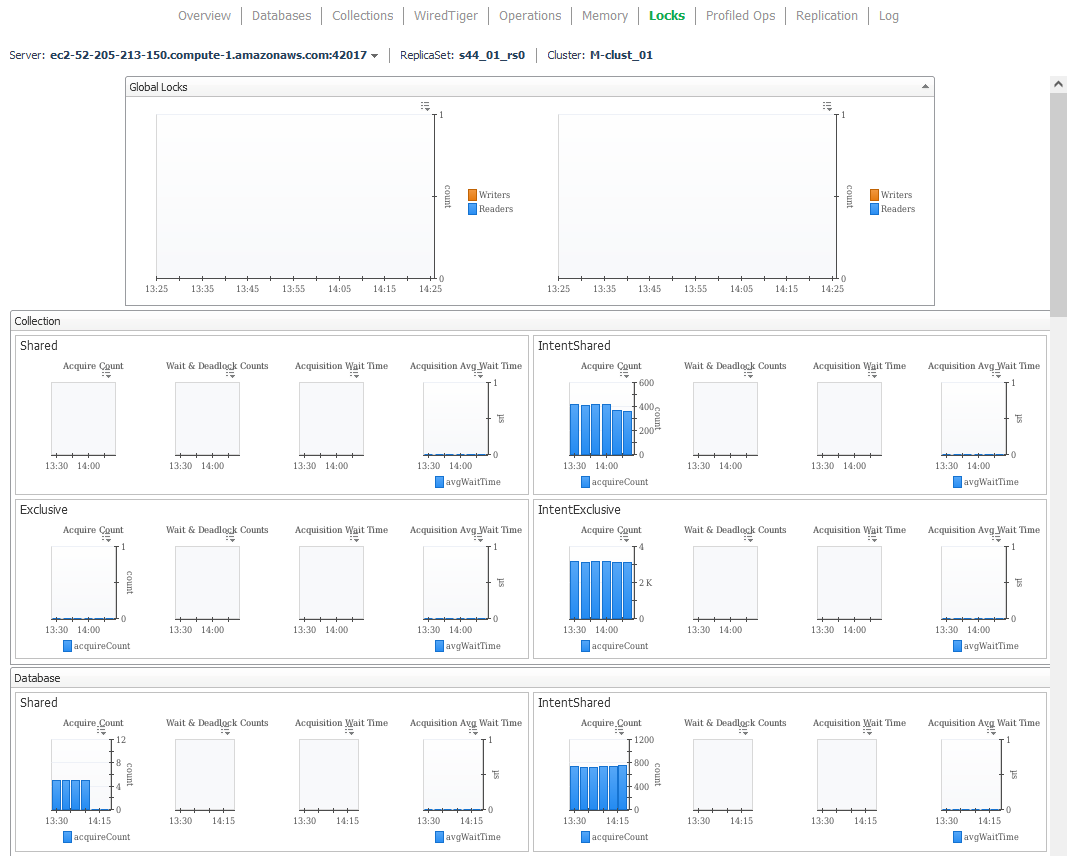
The Locks Dashboard displays a dynamic collection of locks for various lock types. MongoDB collects information on locks at a number of levels within its architecture. This dashboard will capture all lock information present. Examples of lock types include: collection; database; global, and oplog. For each type, metrics are shown for shared, intent shared, exclusive, and intent exclusive locks.
Current Operations
The Current Operations dashboard shows active operations running on the MongoDB instance at the time of data collection. Operations that take a long time to complete are likely to be captured as current operations. The view includes indicators for ops that had to wait, that had conflicts, and are pending being killed, among other conditions. Charts show relative activity by database component, e.g. namespace or user, as well as by operation type, e.g. find or command. Users and the number of operations and namespaces they are interacting with. Resharding operations are visible as they occur. Full details on current operations within the dashboard’s time frame are shown in table format at the bottom of the dashboard. This ops table can be filtered by user, namespace, command type, indicator category, etc. by clicking on the respective item in one of the other dashboard components.

Slow Operations
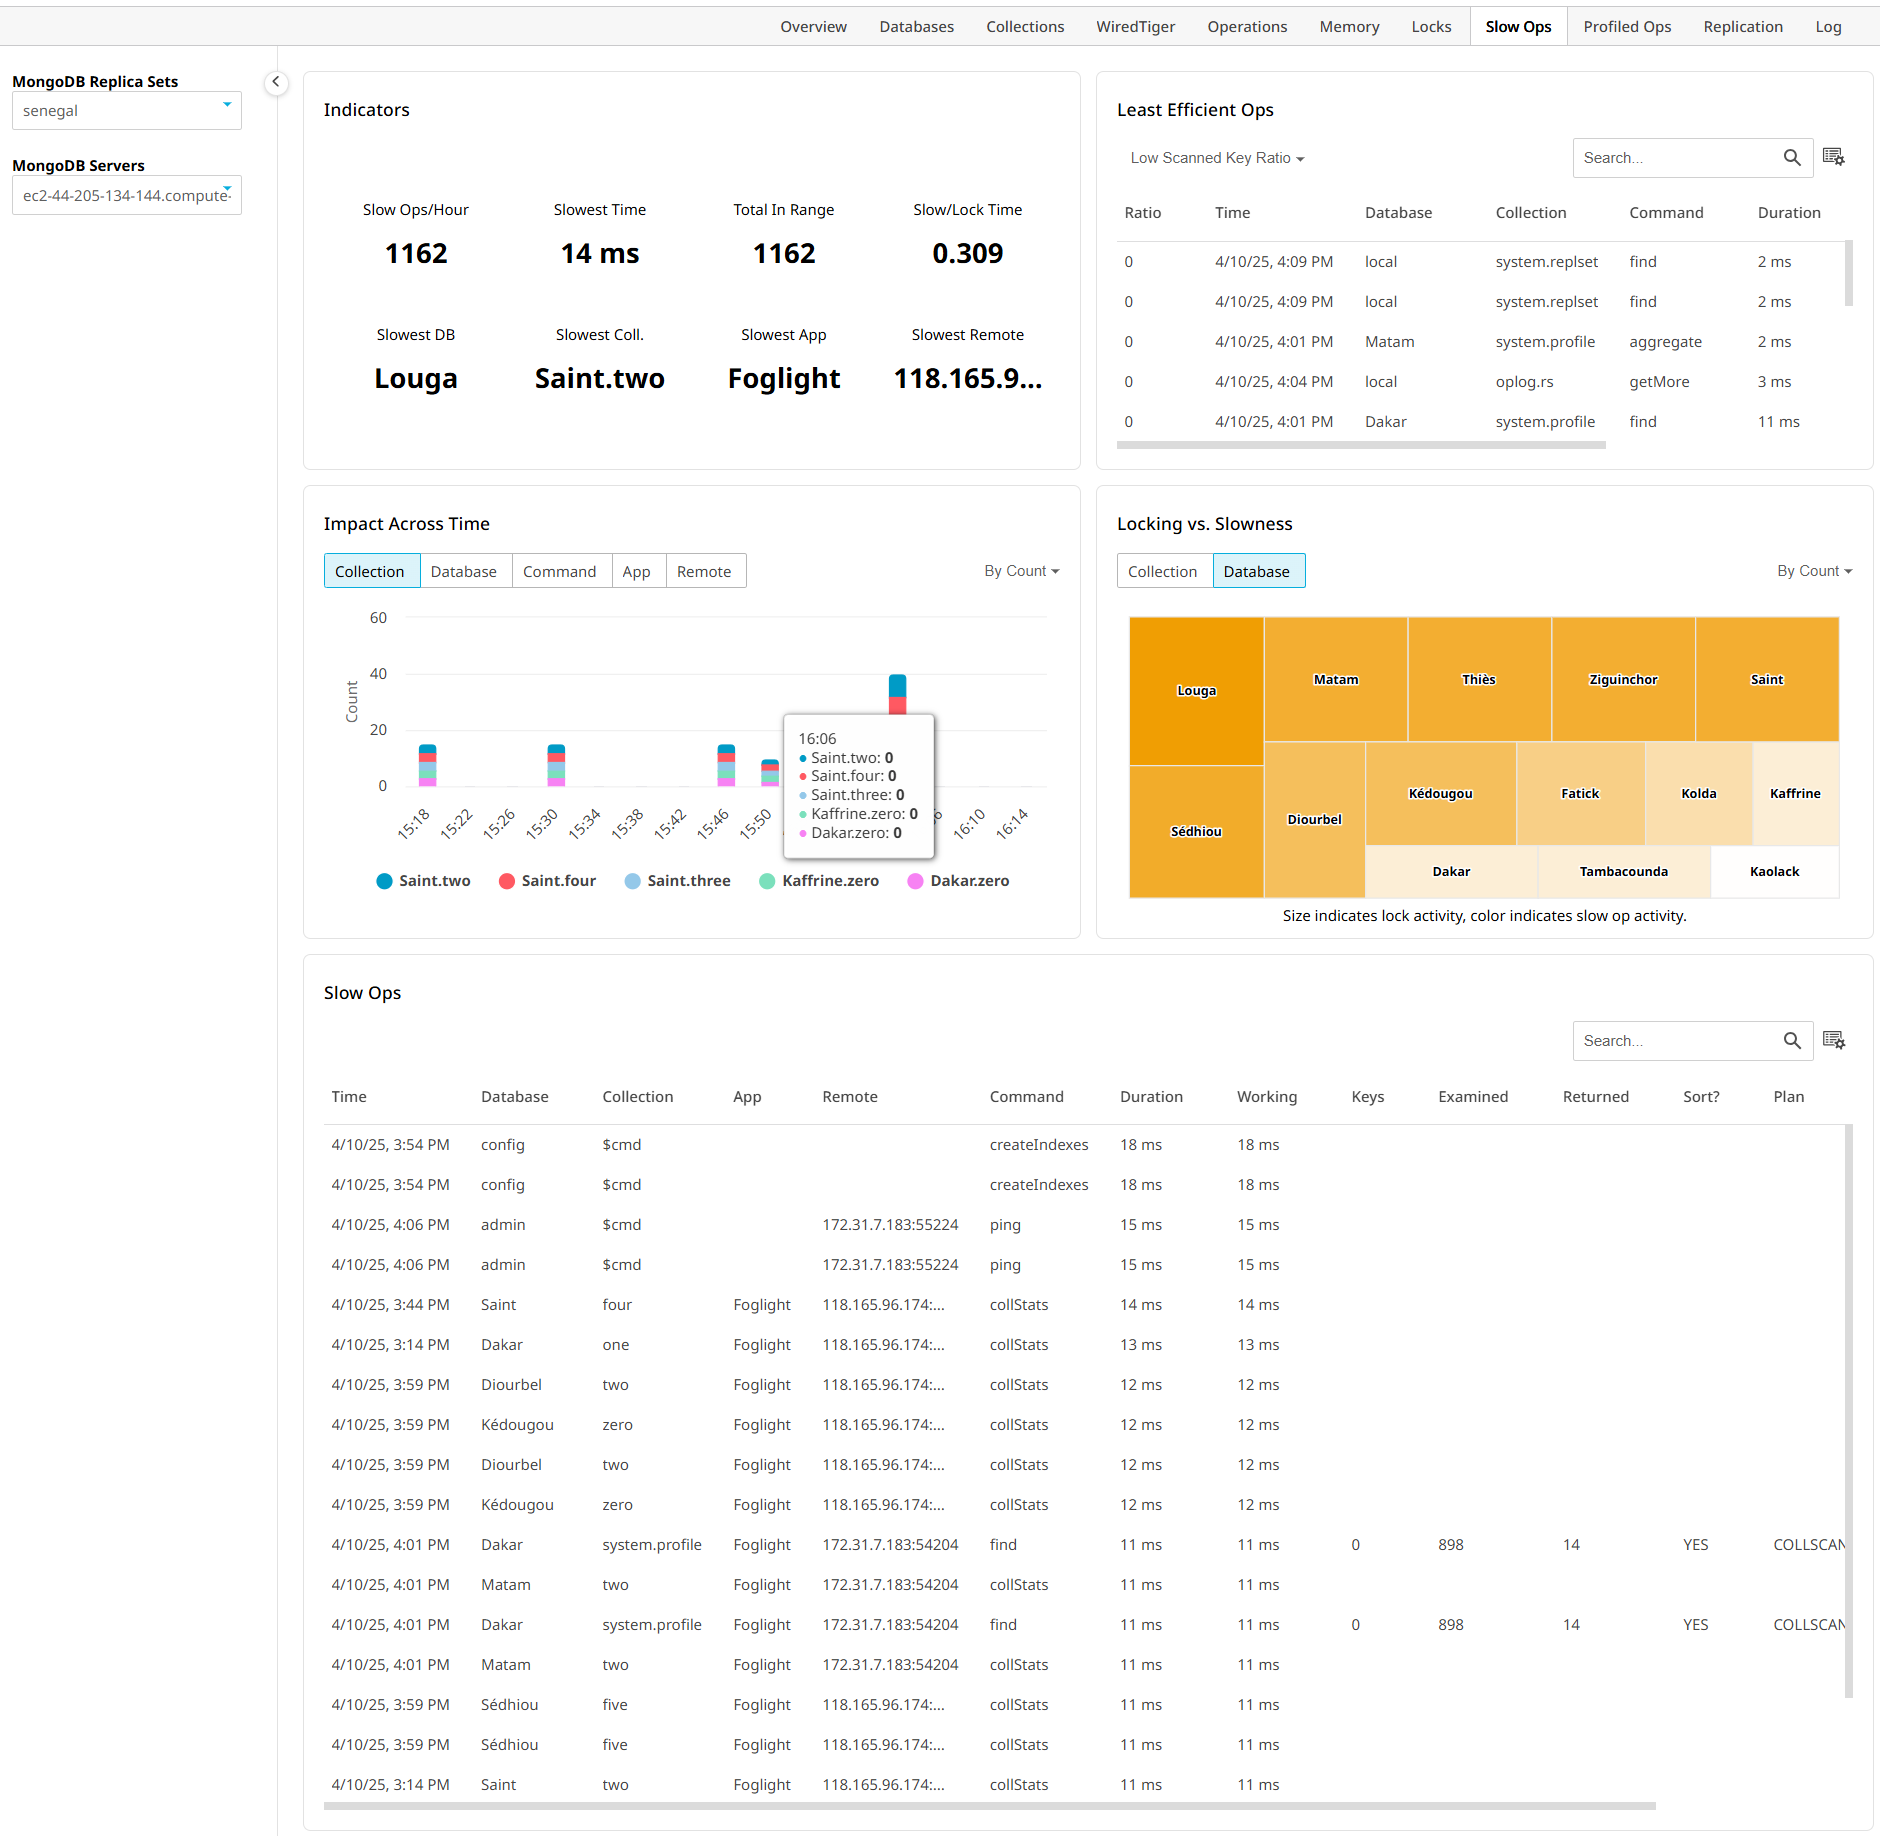
The Slow Operations dashboard provides insight into operations that the MongoDB server has identified as long-running. Slow operation entries are read from the DB log. The threshold for which entries are identified as slow are configured in the database instance’s profiler. Which slow operations are collected and displayed by Foglight are configurable further in the agent properties. The view includes:
- High level indicators for slowest database and collection, slow operation rate, etc.
- Table of operations least efficiently making use of available indexes.
- Slow operations across time by collection, command, remote, etc. Operations can be displayed by either count of slow operations or operation duration.
- Heat map comparing total locking vs slow op activity on the top slowest databases or collections.
- Table of slow operations within the time range.
Profiled Operations
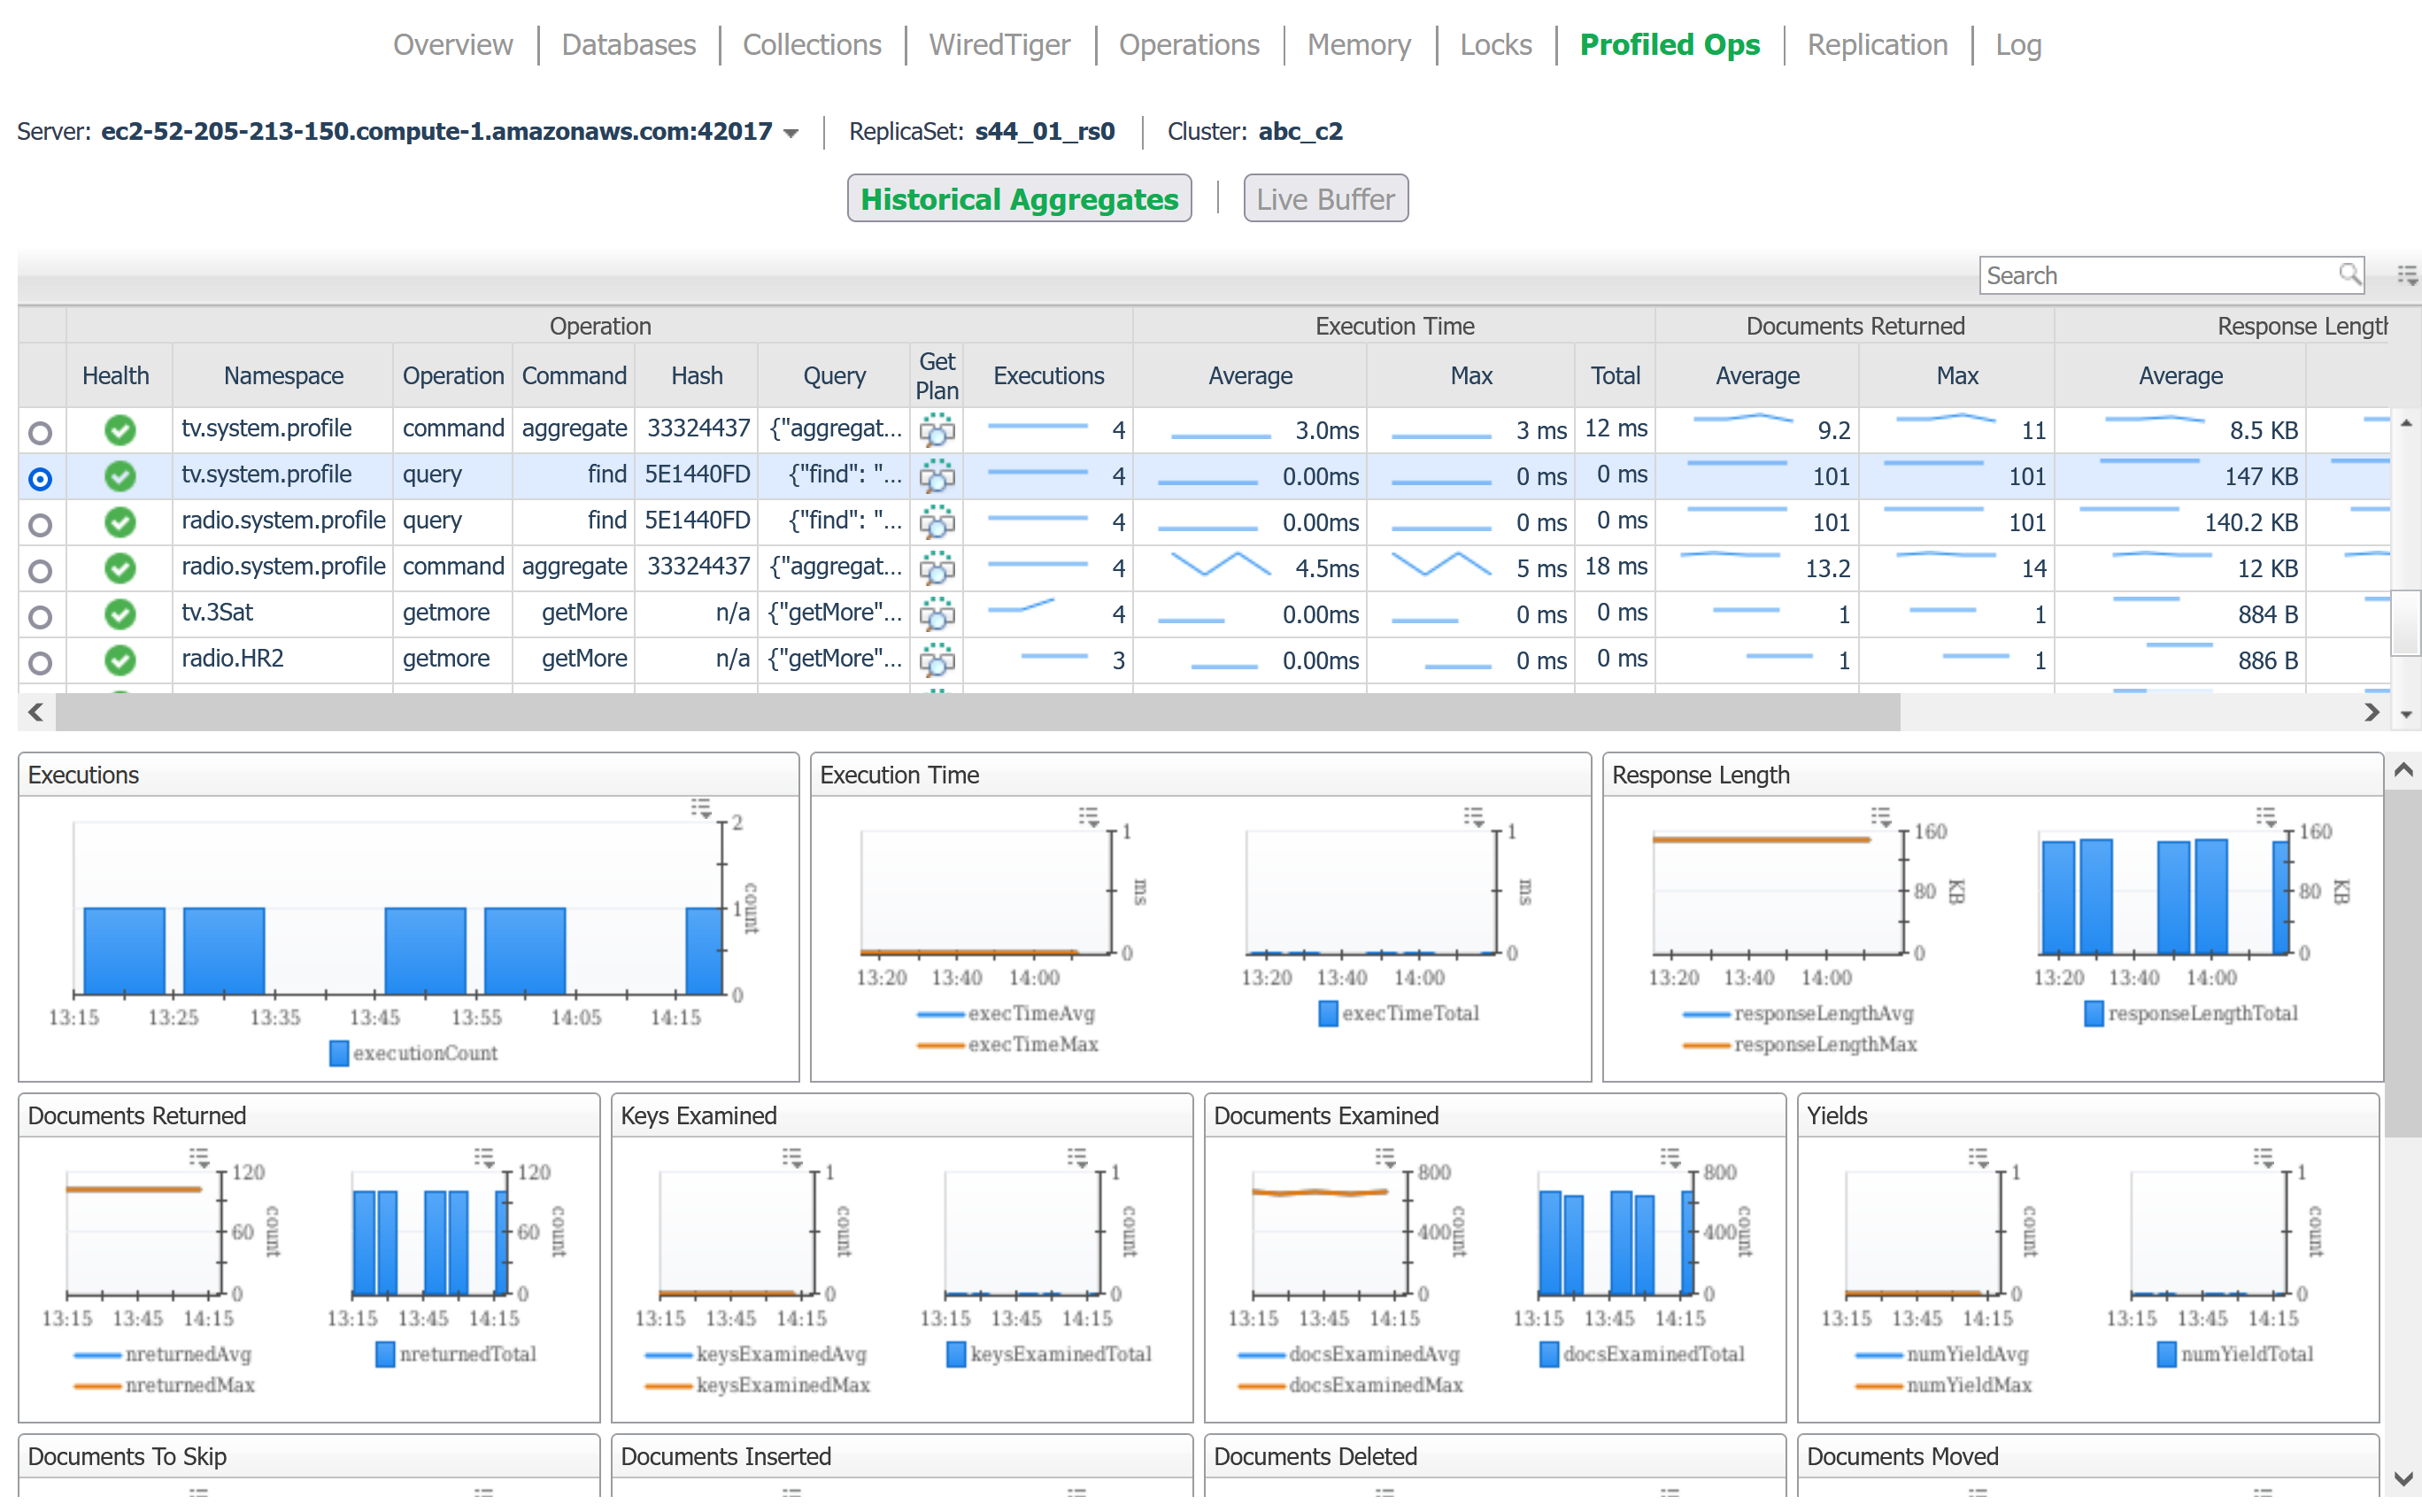
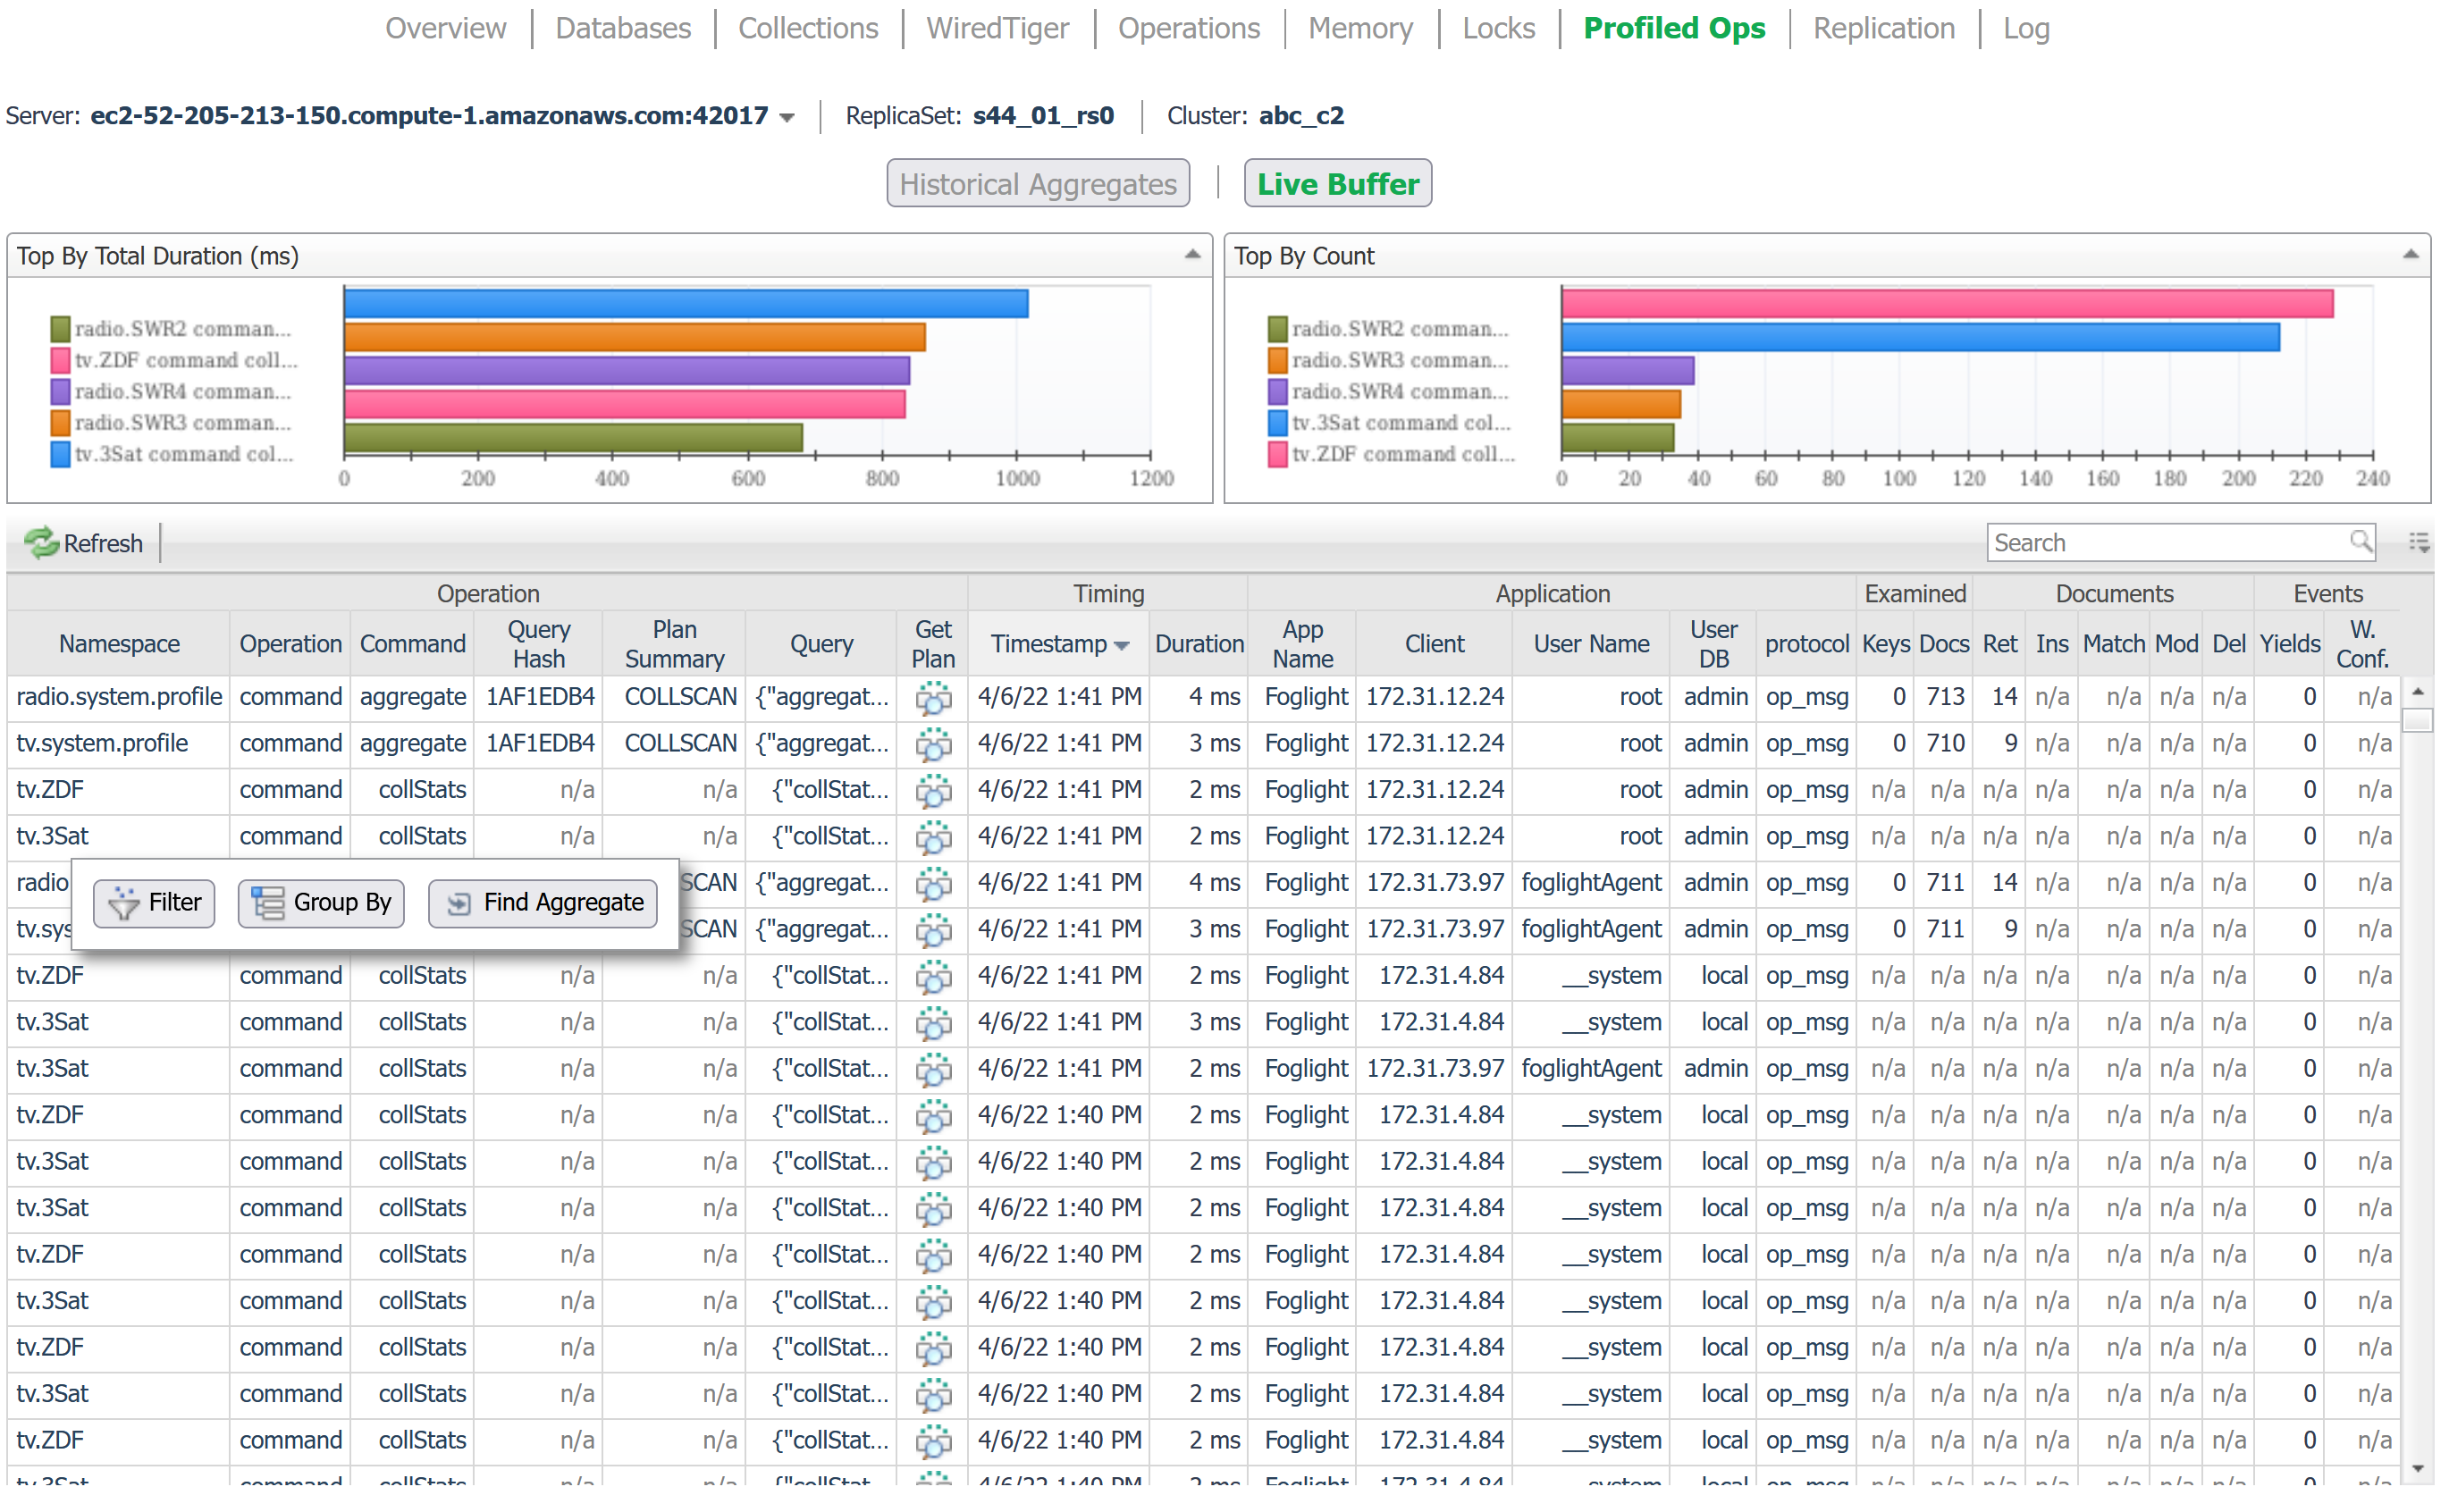
This dashboard has two main views: the Historical Aggregates view and the Live Buffer view. The Historical Aggregates view shows collected profiled operations that have been aggregated into groups for statistical analysis. System profiling must be enabled on the MongoDB server. Profiled operations are collected for a maximum of 20 databases. Metrics shown in the table are for the selected period (the time window selected at the top-right of the page). The page shows general data on each operation, such as executions and execution time, documents returned, response length, and scanned objects as well as information specific to the type of the selected operation. Click the icon in the “Get Plan” column for applicable query types to retrieve an explain plan for that query.
The Live Buffer view shows the details of individual profiled operations currently visible on the MongoDB instance. The top 5 operations by total duration and by count are displayed, along with a list of current operations. Three actions are available for any non-numerical property: Filter, Group By, and Find Aggregate. Additionally, the live buffer entries can be updated by clicking the Refresh button. The Filter action updates the table to only show operations with the selected value of the respective property (table column). Multiple columns can be filtered sequentially. Click the icon in the “Get Plan” column for applicable query types to retrieve an explain plan for that query.
Group By aggregates the entries in the live buffer according to the selected property (table column). Unique values for other properties are presented, along with aggregated numeric values. One group is shown in detail at the top. Other groups may be moved to the detail view by selecting the respective value of the property grouped by (the first column of the “Other Groups” table.
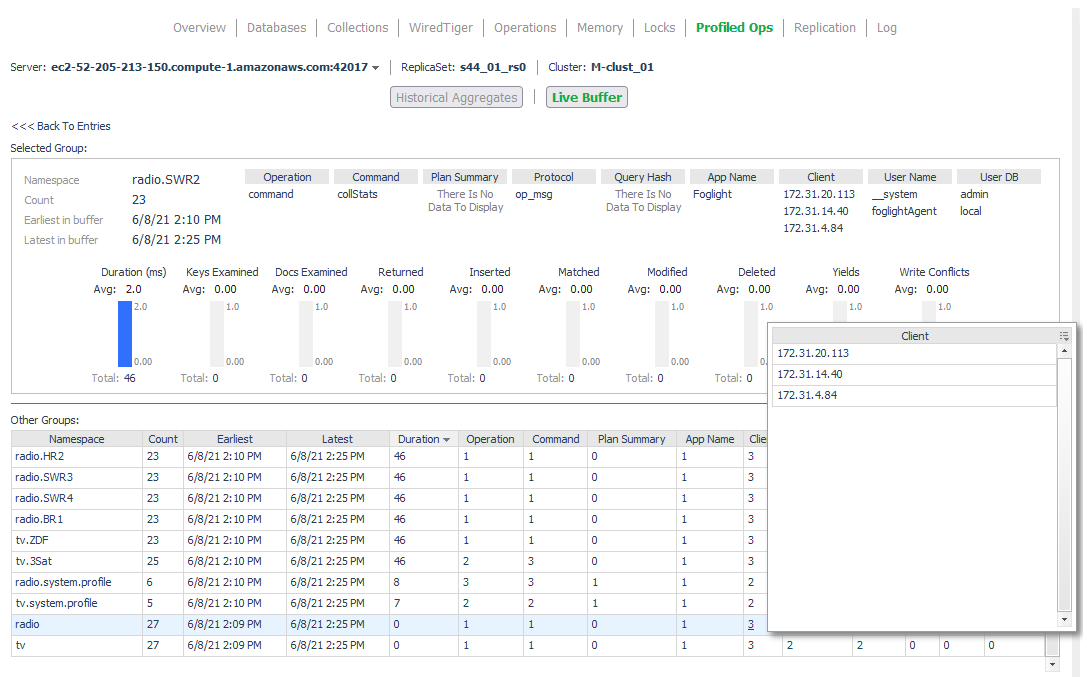
The Group By action is performed on the currently visible live buffer entries. Hence it may be preceded by the Filter action to see an aggregated view of a filtered subset of the currently available data.
Finally, the Find Aggregate action switches to the Historical Aggregate view and selects the aggregated operation entry corresponding to the selected Live Buffer entry.
Replication
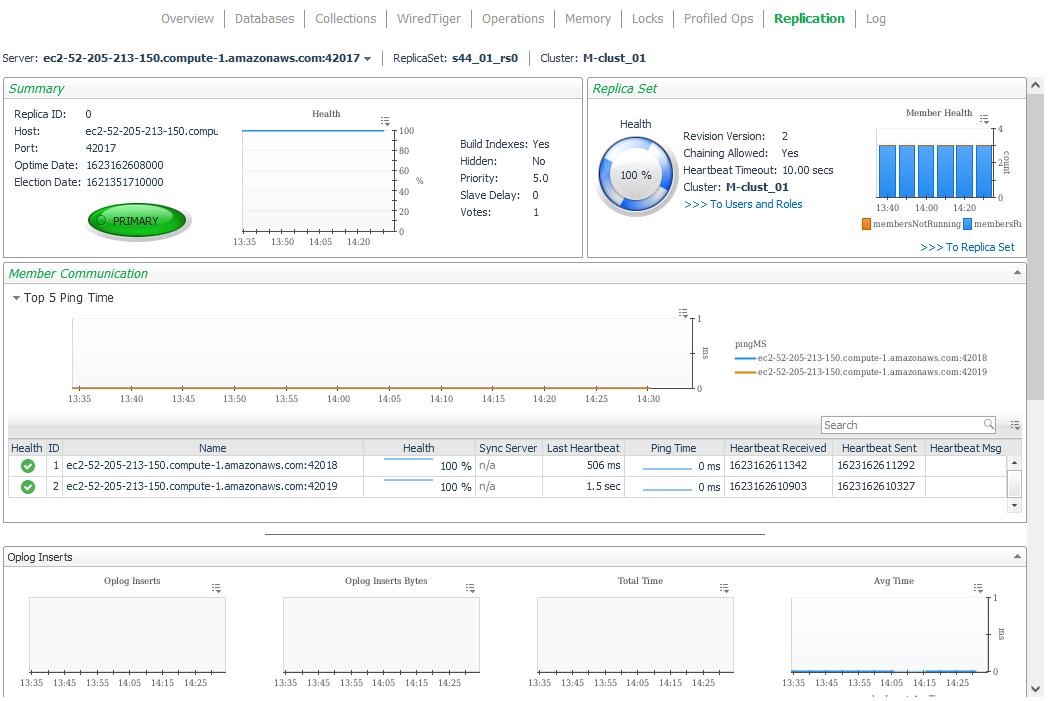
This dashboard shows Replication information for a MongoDB server. It contains summaries of the server status and replica set to which it belongs, followed by a section on Replica Members as seen from the current server’s perspective, followed by performance metrics covering operations used in the replication process.
Log
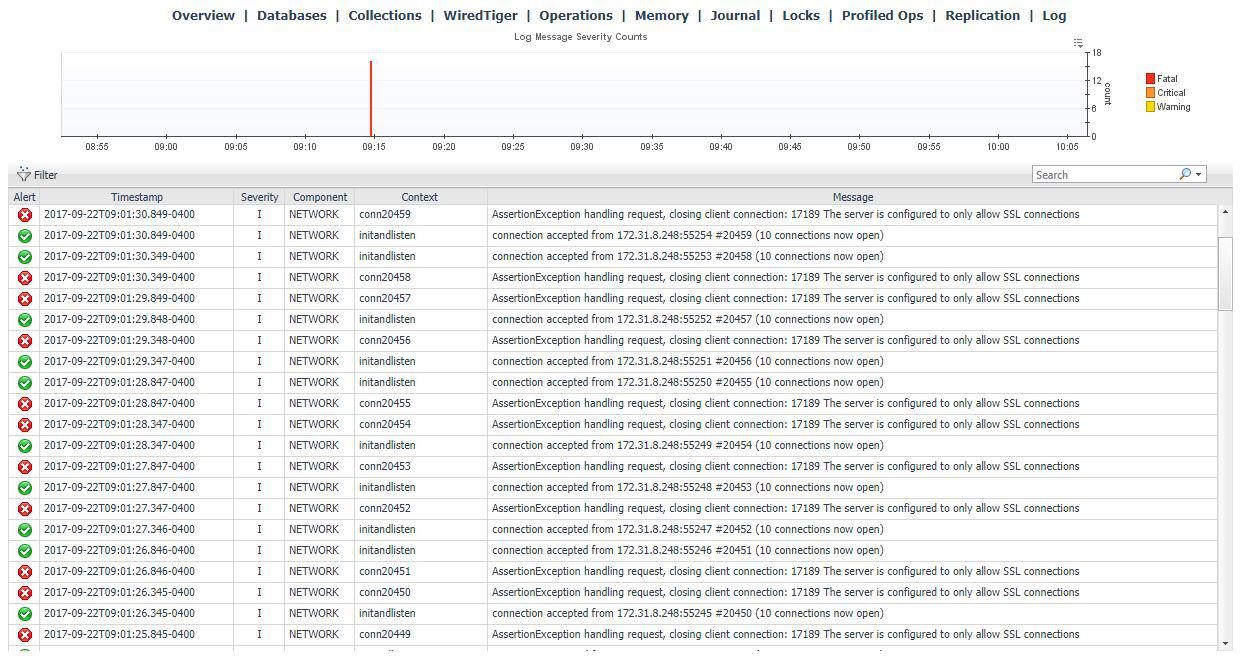
The log dashboard samples current log entries generated by the MongoDB process. Entries that have generated an alert are graphed above, while all alerts displayed can be filtered by log severity (Fatal, Debug, etc.) or log component (NETWORK, SHARDING, STORAGE, etc.).
Users and Roles
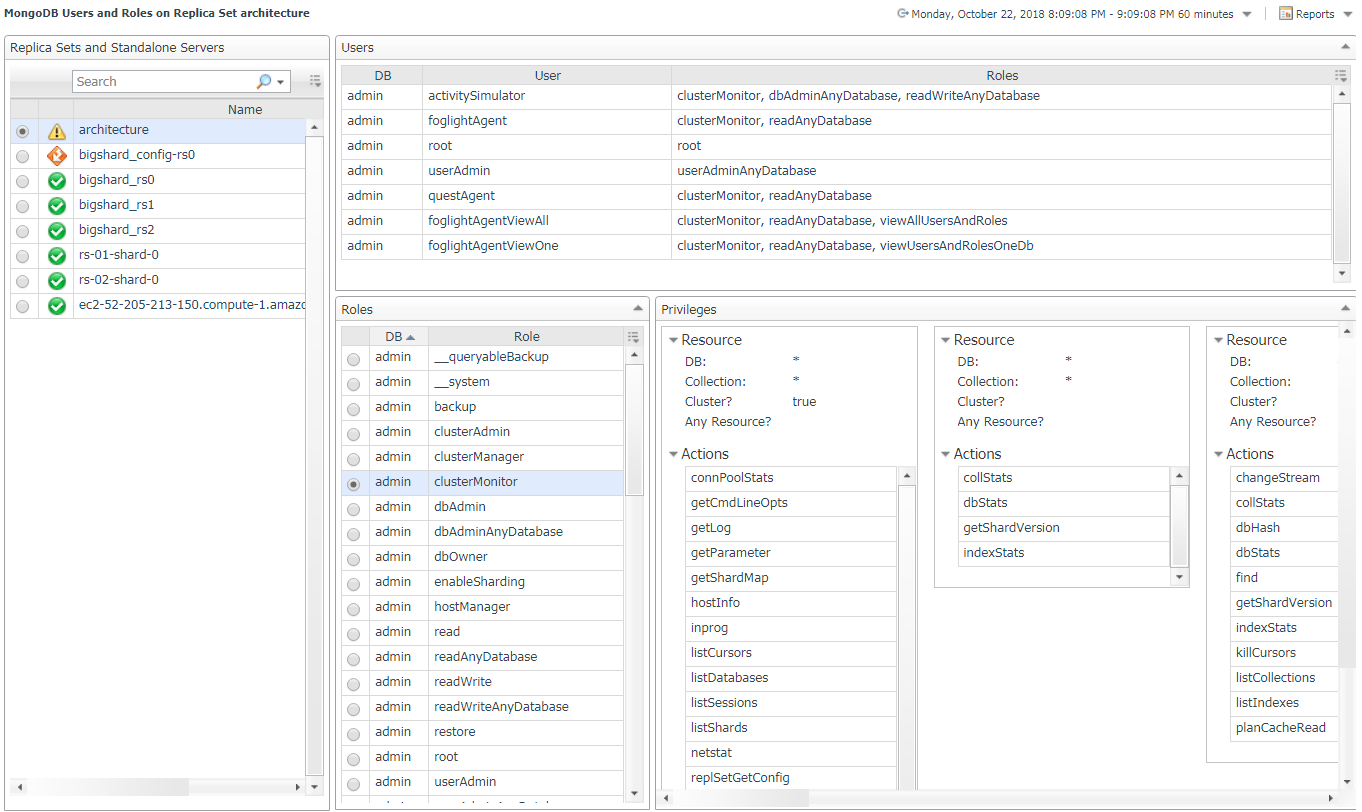
The Users and Roles dashboard shows all users, roles, and privileges visible on the server. They are organized by the replica set or standalone instance on which they are found. Note that the users on a sharded cluster that are accessed through the mongos query servers are those that are found on the cluster’s config server replica set. Select an individual role to see its associated actions.
MongoDB Object Cleanup
This dashboard is a convenient utility for deleting MongoDB topology objects which are no longer being monitored. First, click the “Find Old Objects” button in the table header, then input the requested information and click “Find”. The Days Old field will narrow the filter to objects which have been updated in X number of days. Include Types allows you to select the topology types you want to delete. The For Agents table will include or exclude data from the selected agents depending on the option selected. Once objects have been found, they can be selected and deleted from the FMS.


