Viewing Dashboards
The installation of the Cassandra Cartridge includes the Cassandra Dashboards. The Cassandra Cartridge offers these principal dashboards:
- Cassandra Clusters
- Cluster Keyspaces
- Cluster Tables
- Traces Sample
- Node Overview
- Node Keyspaces
- Node Tables
- Node Table
- Client Requests
- Connections
- JVM
- Cache
- Thread Pools
- Slow Query Log
Drill downs from these dashboards are available to expose more granular data. It should be noted that there is a great deal of additional information that is collected that is not displayed in these primary dashboards. Should an operator wish to have that information displayed, Foglight allows for the creation of simple drag and drop dashboards.
Cassandra Clusters
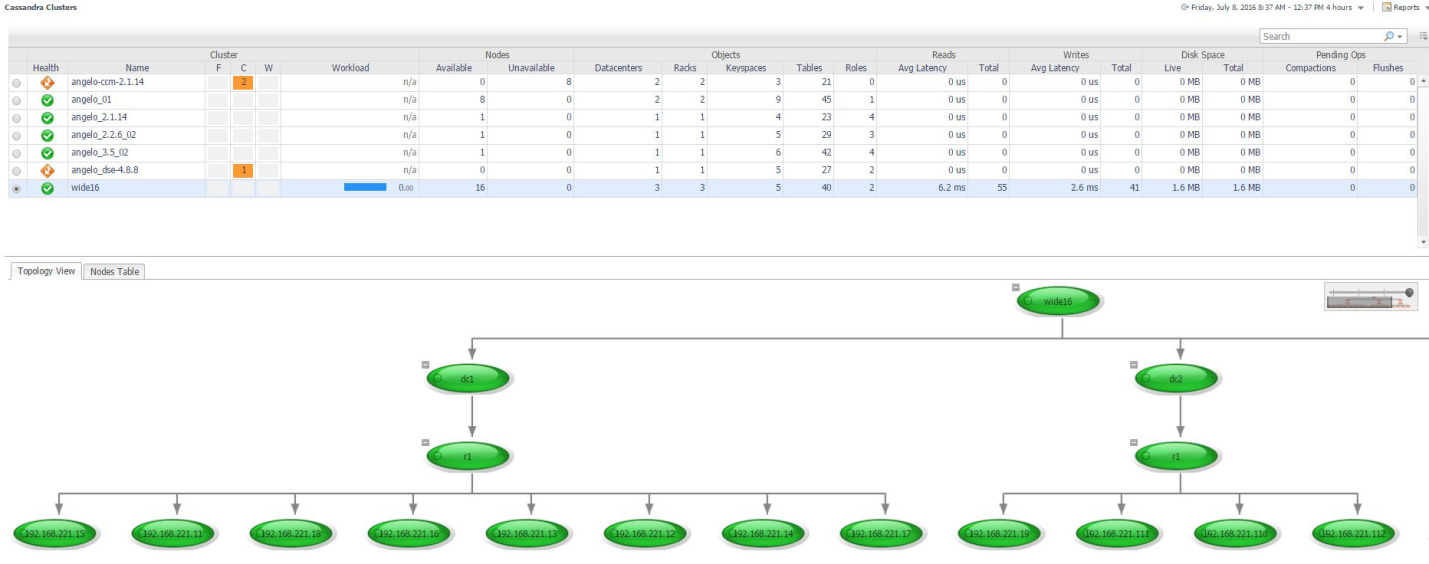
This dashboard lists all monitored Cassandra Clusters and contains high-level information on cluster structure, nodes, health status, and key metrics. The workload metric is used for comparing the amount of work a node is doing. Cluster workload averages the workloads of all nodes in that cluster. Selecting a cluster will update the bottom section of the page and display either a topology view of the cluster structure or a list of nodes with relevant information. In the Topology View tab, hovering over an object will show a health summary, while clicking on a node will drill down to the Node Overview page, as will clicking on a node location in the Nodes Table. In the cluster table, clicking the Keyspace or Table column values will drill down to the Cluster Keyspaces and Cluster Tables pages, respectively. Other column values for metrics will show a time plot when hovered or clicked on.
Cluster Keyspaces
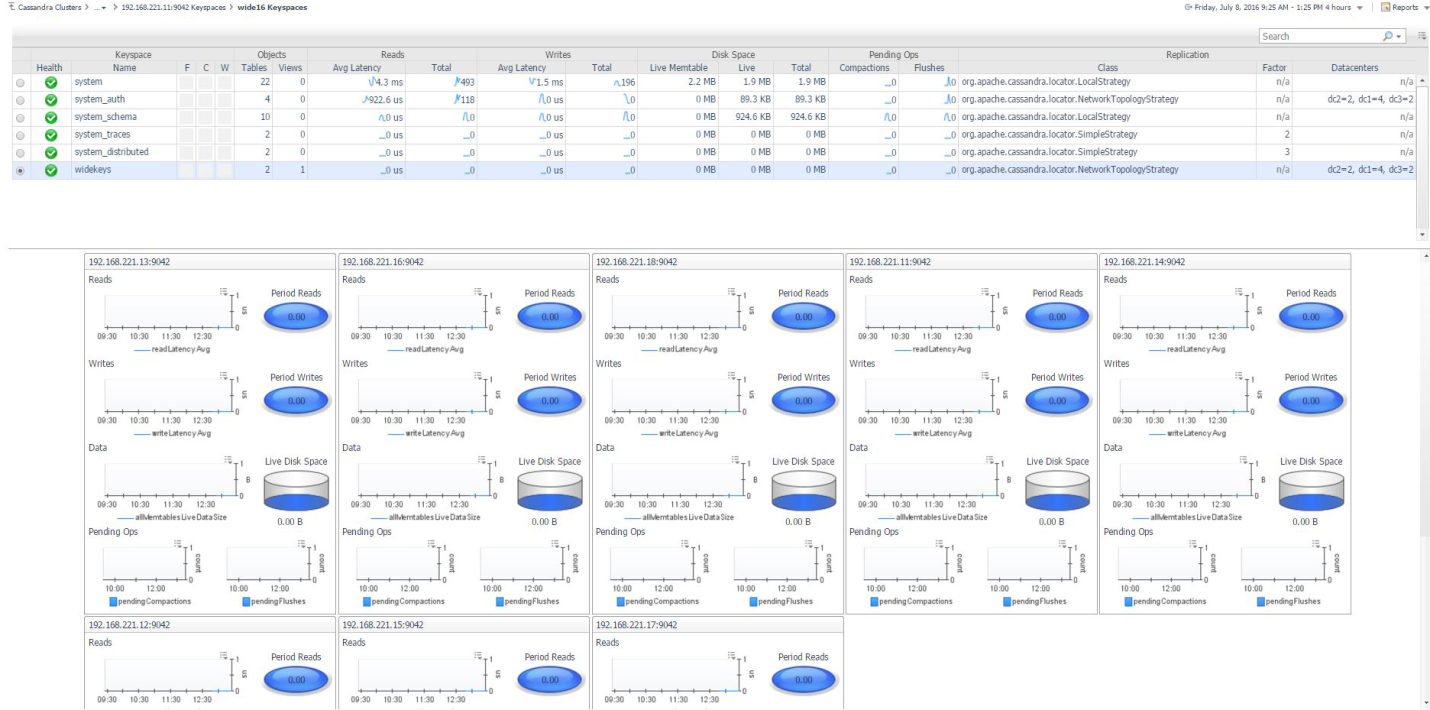
This page lists all keyspaces in the selected cluster, aggregating metric information across nodes. Selecting a keyspace will update the section below, displaying a summary of that keyspace for each node in the cluster. Clicking the node location in the title of each summary will drill down to the Node Tables page for the selected node, filtering for only tables in that keyspace. In the Keyspace table, selecting the Tables column value will drill down to the Cluster Tables page, again filtering for only tables in that keyspace.
Cluster Tables
This page lists tables in the selected cluster, aggregating metric information across nodes. Selecting a table will update the section below, displaying a summary of that table for each node in the cluster. Clicking the node location in the title of each summary will drill down to the Node Table page for the selected table. To filter the list of tables by keyspace, click the Select Keyspaces button at the top left of the table and select one or more keyspaces for which you wish to view tables.

Traces Sample
The Traces page shows sampled entries from Cassandra’s tracing system. Entries with the same query are aggregated and presented by average and maximum sampled duration. Tracing is not enabled by default, but nodetool can be used to enable tracing on a portion of all queries with its subcommand “settraceprobability”.
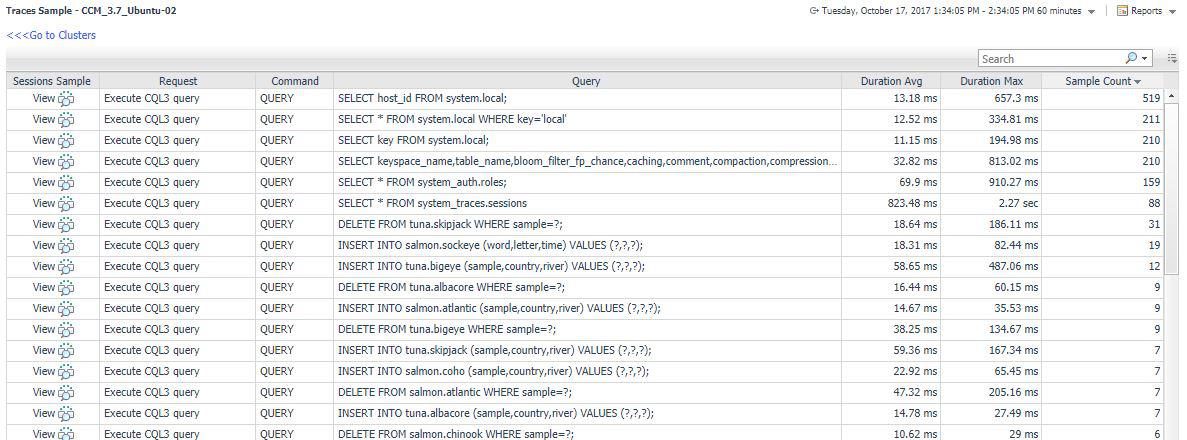
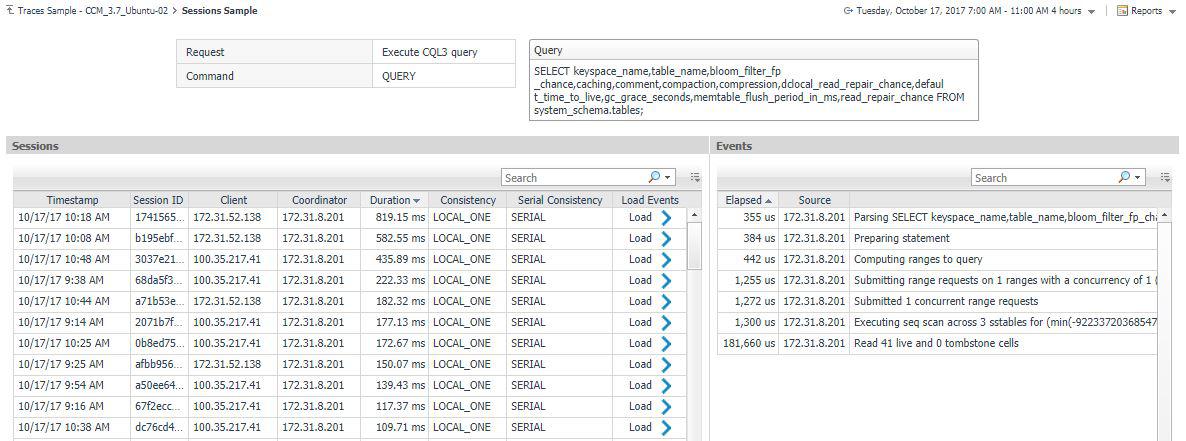
Individual query executions, called “sessions”, are retrieved along with each execution duration, timestamp, source, consistency level, etc. The internal events generated to process the query are retrievable per session on demand.
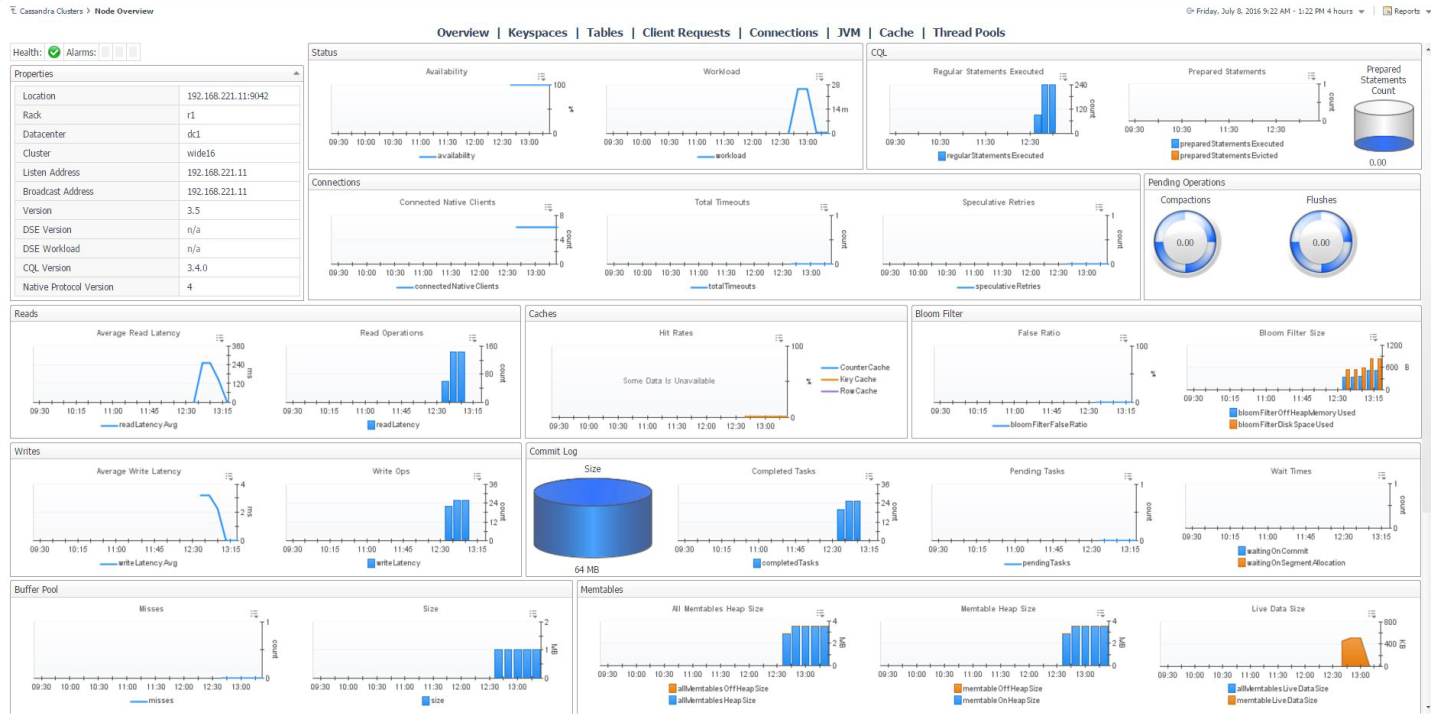
Node Overview
This page provides a comprehensive view of the Cassandra Node, with health and alarms and configuration information at the top left and metrics grouped into relevant categories on the rest of the page. Once in the node section of the dashboards, the navigation bar at the top of the page can be used to navigate between different pages containing more information on the selected node. The Node Selector in the action panel on the right can also be used to switch between nodes in the same cluster.
Node Keyspaces
This page lists all keyspaces on the selected node, with metric information on reads and writes, latency timing, disk space, and pending operations. Clicking the Keyspace Name or Tables column value will drill down to the Node Tables page, filtering for only tables in that keyspace. The “Go to Cluster Keyspaces” link above the table will link to that page for the same cluster, where you can compare keyspaces across different nodes by selecting a keyspace row.

Node Tables
This page lists tables on the selected node, aggregating metric information across nodes, with metric information on reads and writes, latency timing, disk space, and pending operations. Clicking the Table Name column value will drill down to the Node Table page for more information on that table. The “Go to Cluster Tables” link above the table will link to that page for the same cluster, where you can compare tables across different nodes by selecting a table row. To filter the list of tables by keyspace, click the Select Keyspaces button at the top left of the table and select one or more keyspaces for which you wish to view tables.

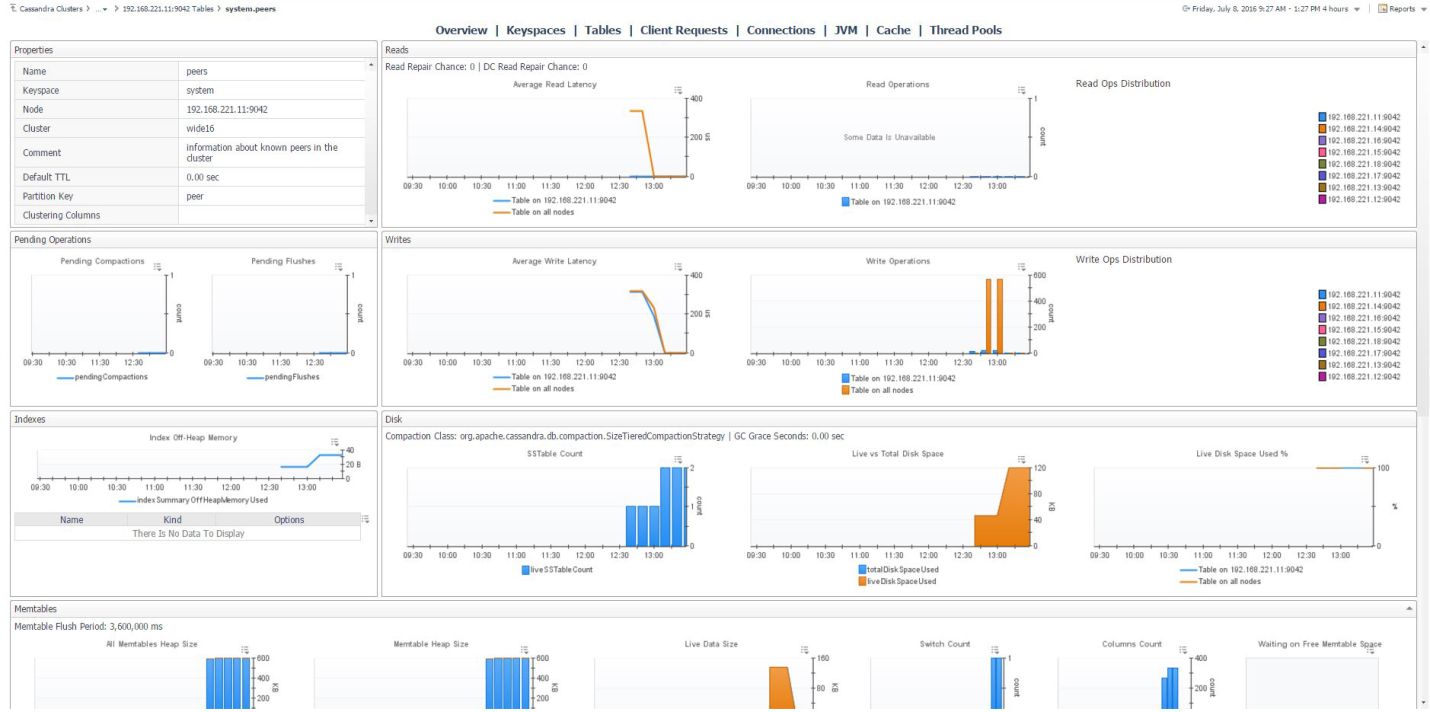
Node Table
This page provides a comprehensive view of the table, with configuration information at the top left and metrics grouped into relevant categories on the rest of the page.
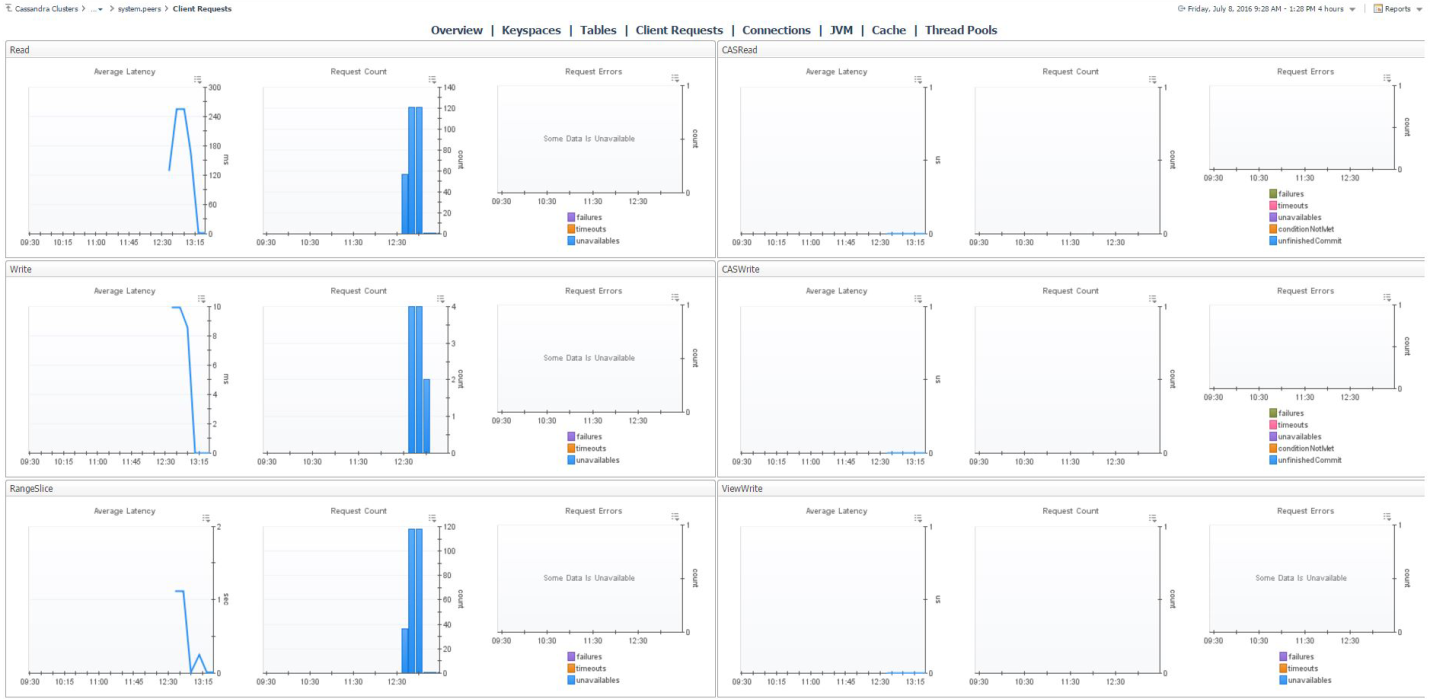
Client Requests
This page displays client requests to the node by type, showing metric histories for average latency, request counts, and request errors, broken down by error type.
Connections
The Connections page shows connections between the selected node and other nodes in the cluster. At the top of the page, three bar graphs show nodes with the most gossip, large, and dropped messages. The below table lists all connections, showing timeouts and result status of messages by task type.

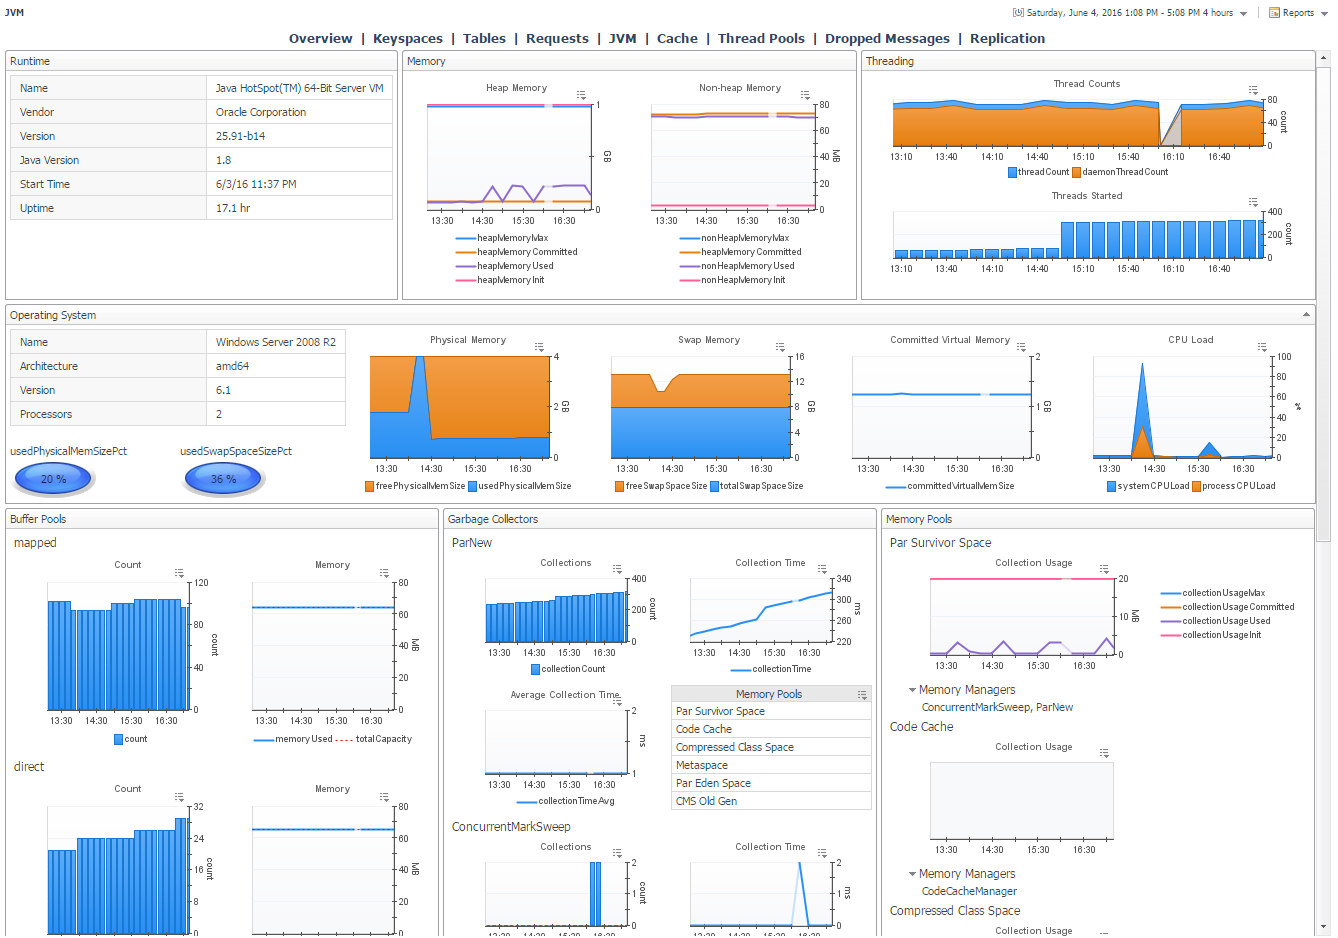
JVM
This page features information on the JVM that Cassandra runs on. The top row contains JVM properties, uptime, and information on memory and threading. The second row displays OS information and memory and CPU metrics. The final row features operational metrics for the various buffer pools, garbage collectors, and memory pools maintained by the JVM.
Cache
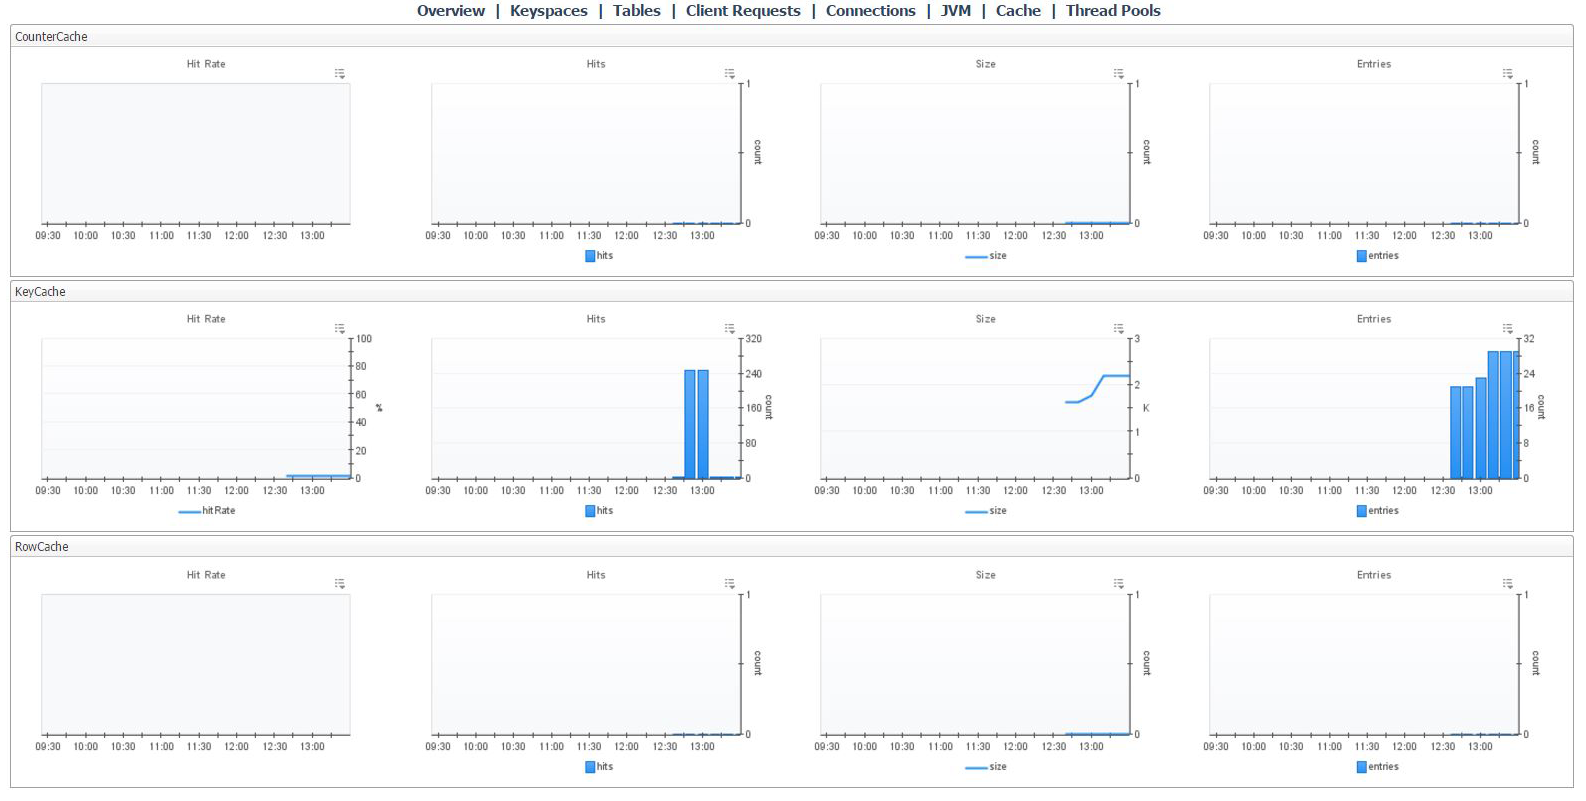
The Cache page features cache-related metrics including hit rate, hits, size and number of entries for the counter cache, key cache, and row cache.
Thread Pools
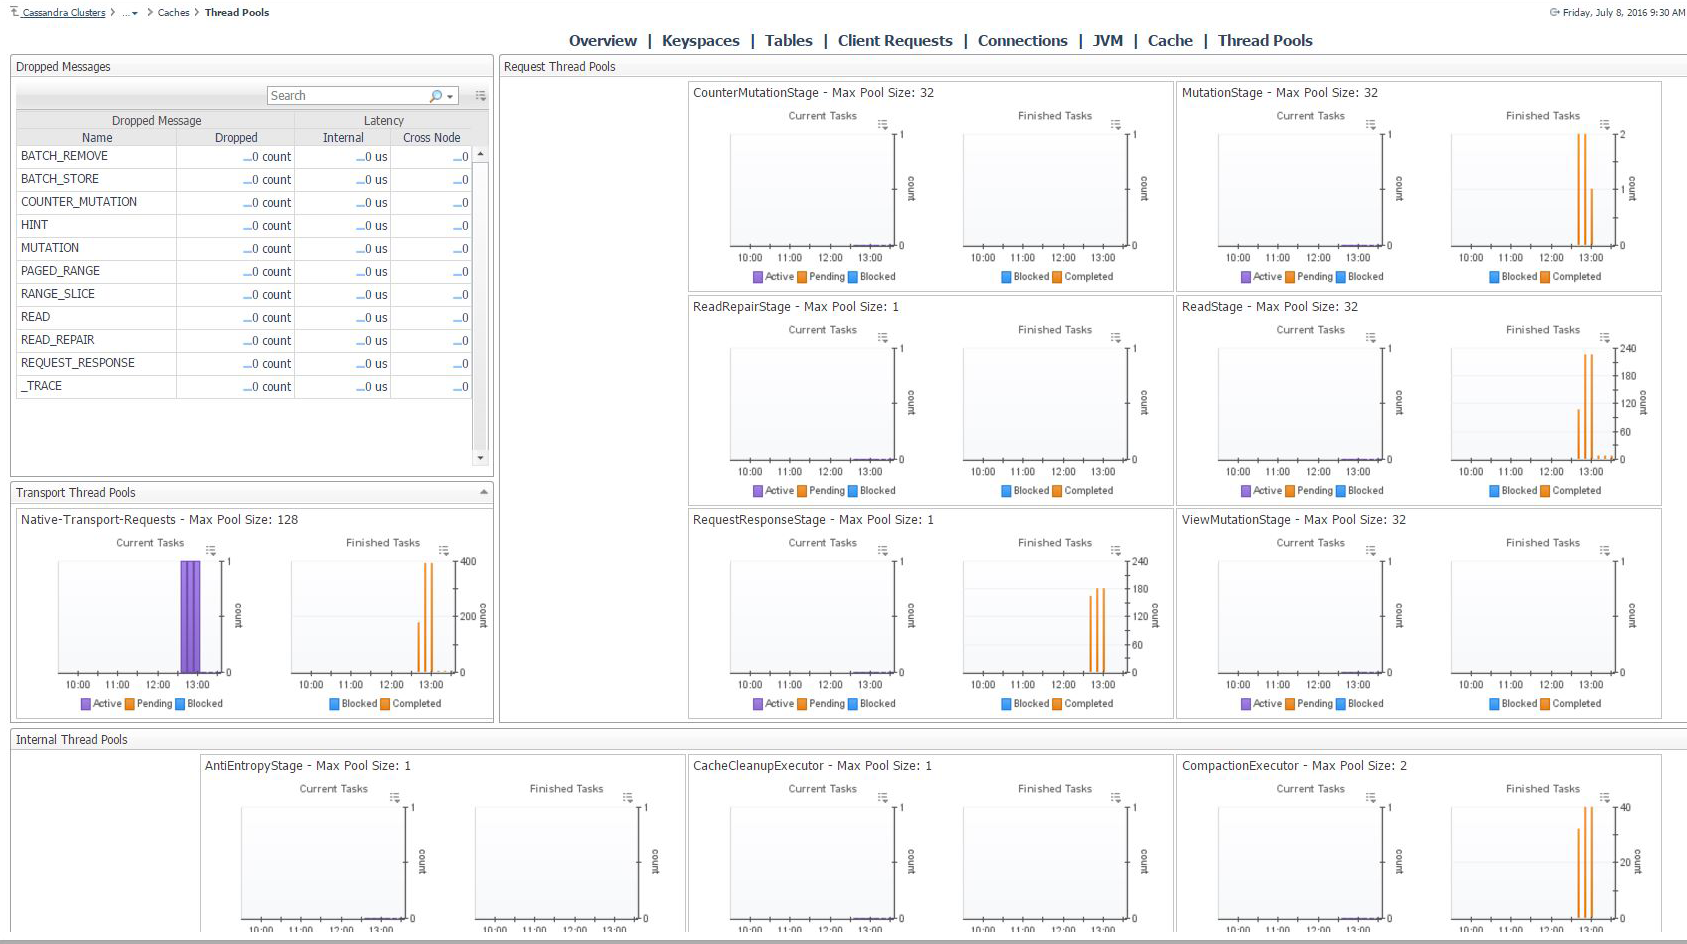
This page displays active and completed task statuses for every thread pool type in the Cassandra node, grouped into Request, Transport, and Internal categories. The page also features a table of dropped messages by stage and includes metrics for number of dropped messages and latencies for internal and cross node dropped messages.
Slow Query Log
The slow query log dashboard displays information on long running queries for DSE Cassandra servers. Slow query logging is enabled by default. The slow query threshold can be raised or lowered with the dsetool “perf cqlslowlog” subcommand.


