Viewing Dashboards
The Atlas MongoDB Cartridge displays multiple dashboards that contain a number of other views that display monitoring data. This cartridge includes the following main dashboards:
This cartridge includes the following main dashboards:
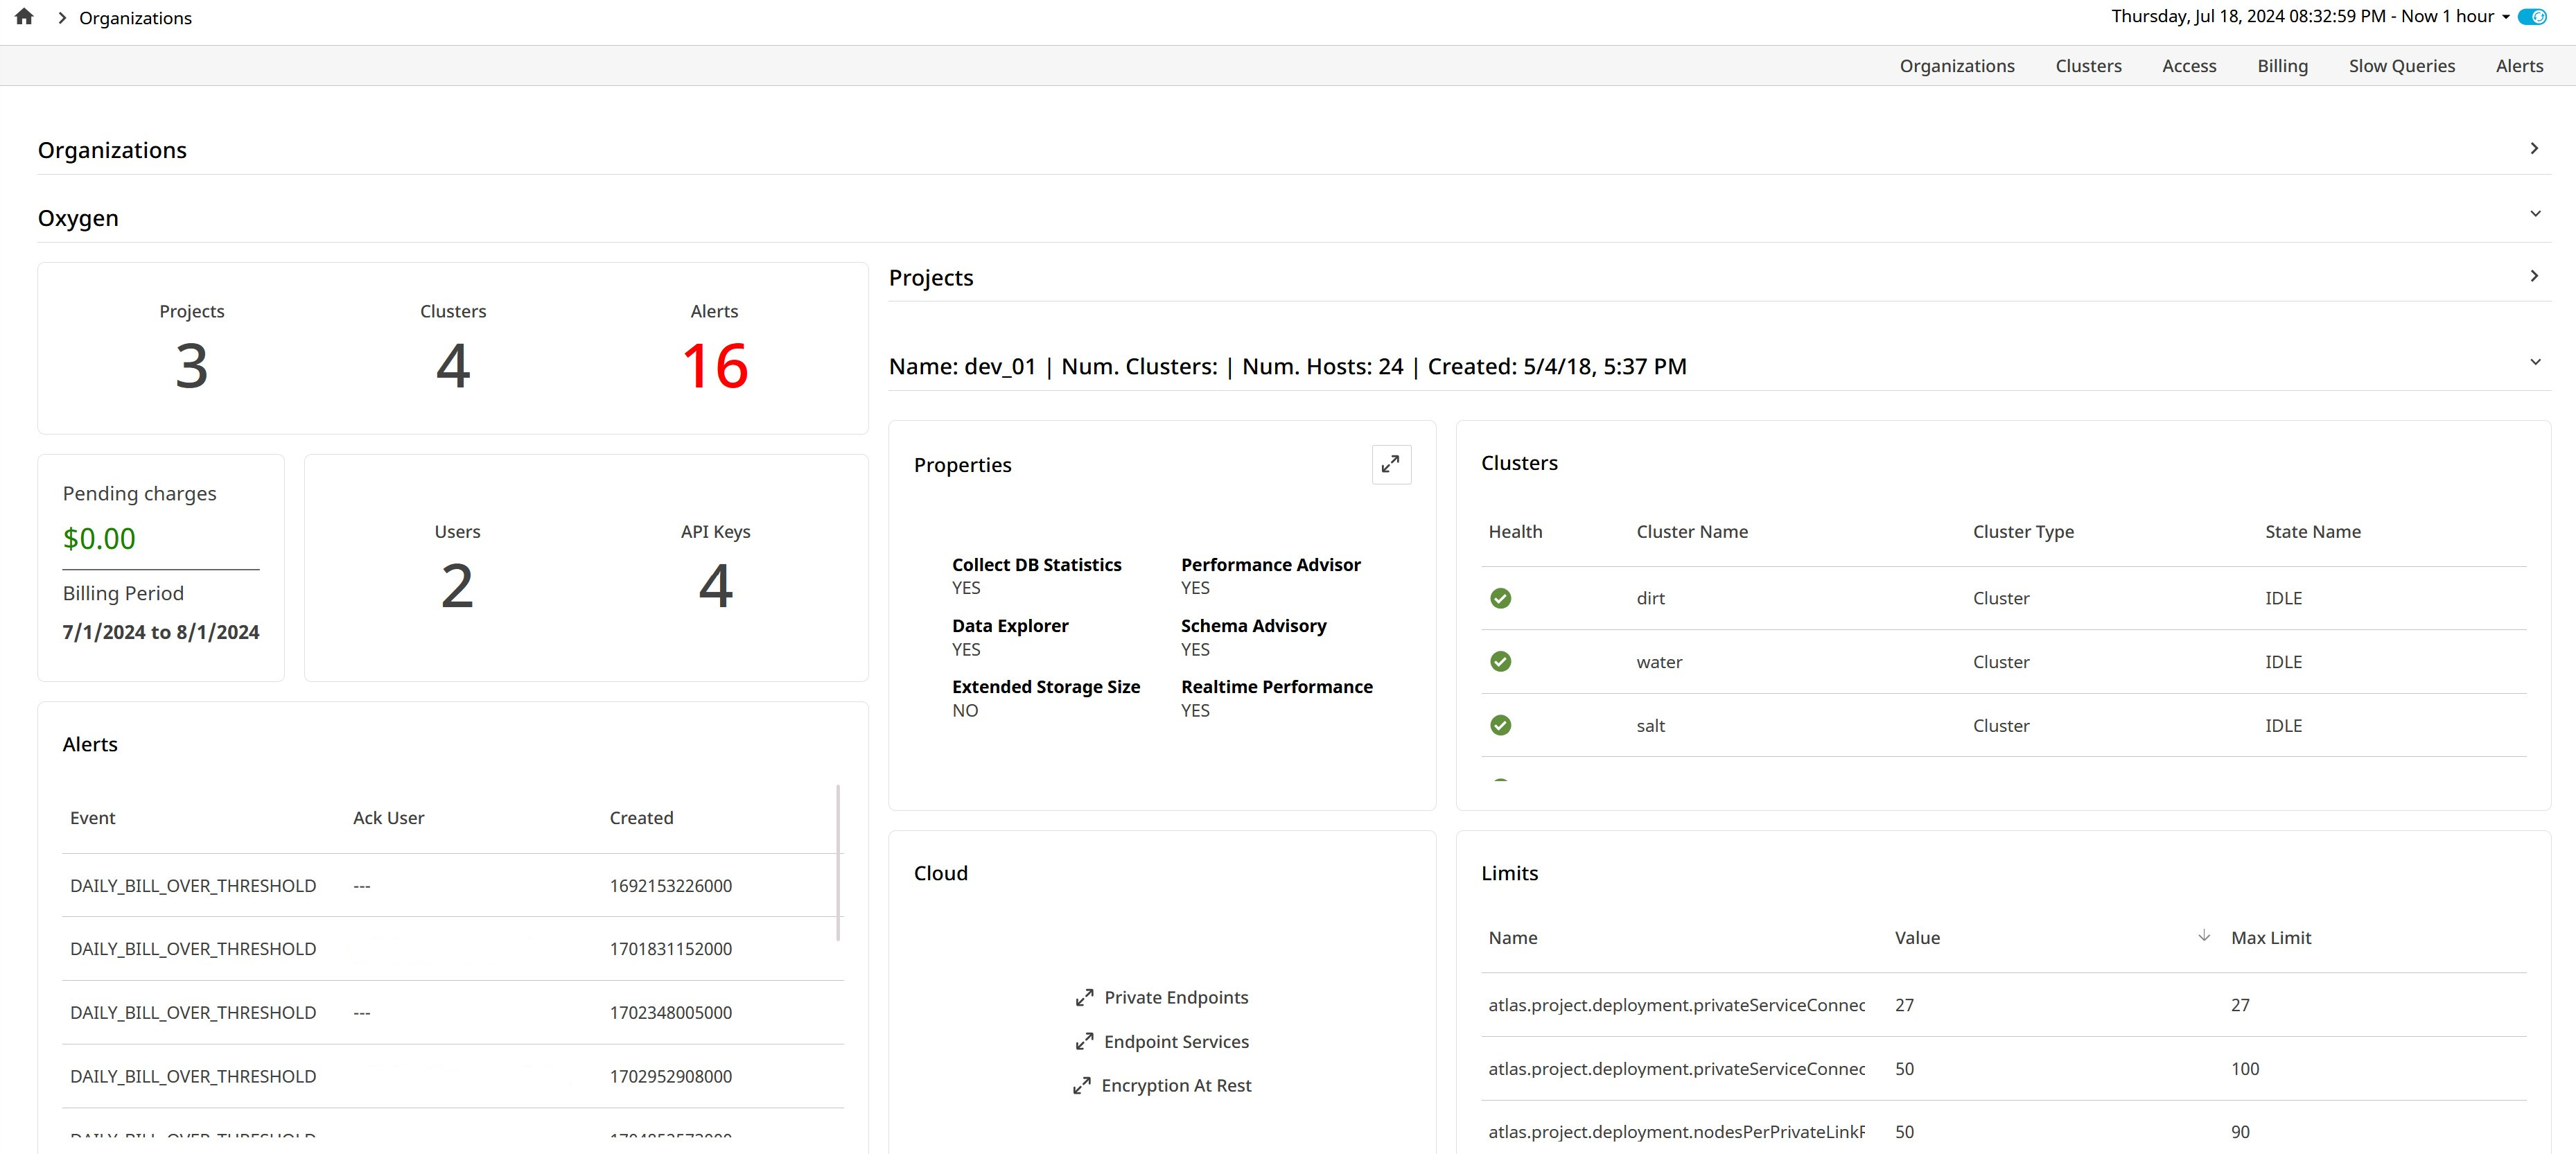
Organizations
The Organizations dashboard displays a horizontally split view. To view this dashboard click Atlas MongoDB in the left navigation pane. The top section lists all Atlas organizations being monitored, and selecting an organization shows its details in the bottom section. The left side presents high-level details, including the number of projects, clusters, alerts, users, API keys, and current billing charges for the organization. The right side features another split view, with the top section listing all projects in the organization and the bottom section showing the clusters within a selected project. Selecting a cluster opens its details on the Clusters page.
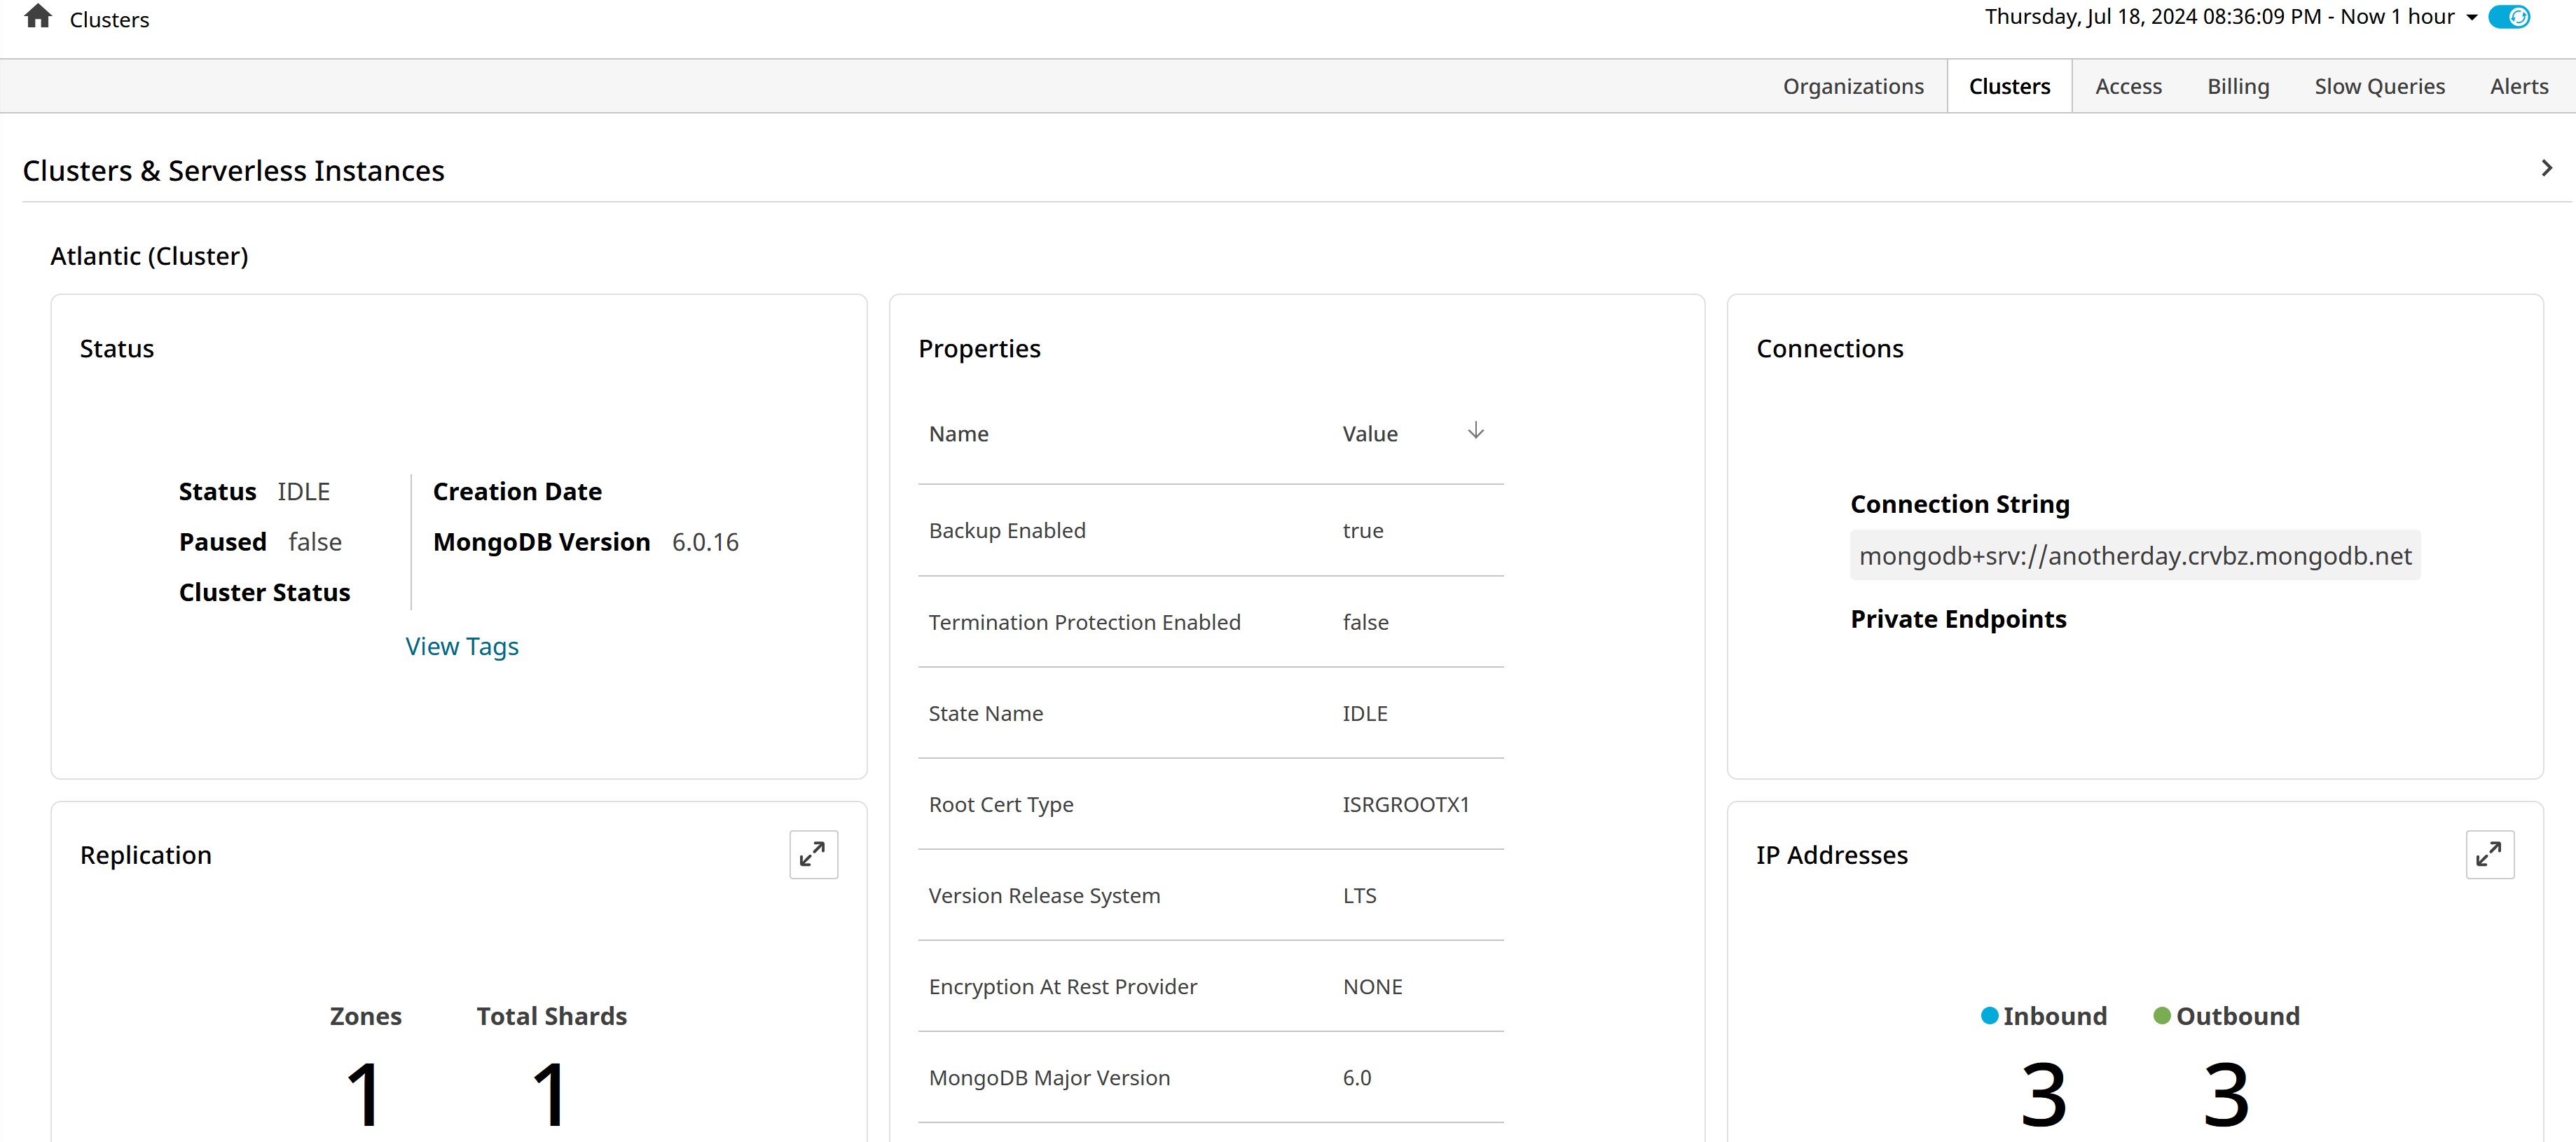
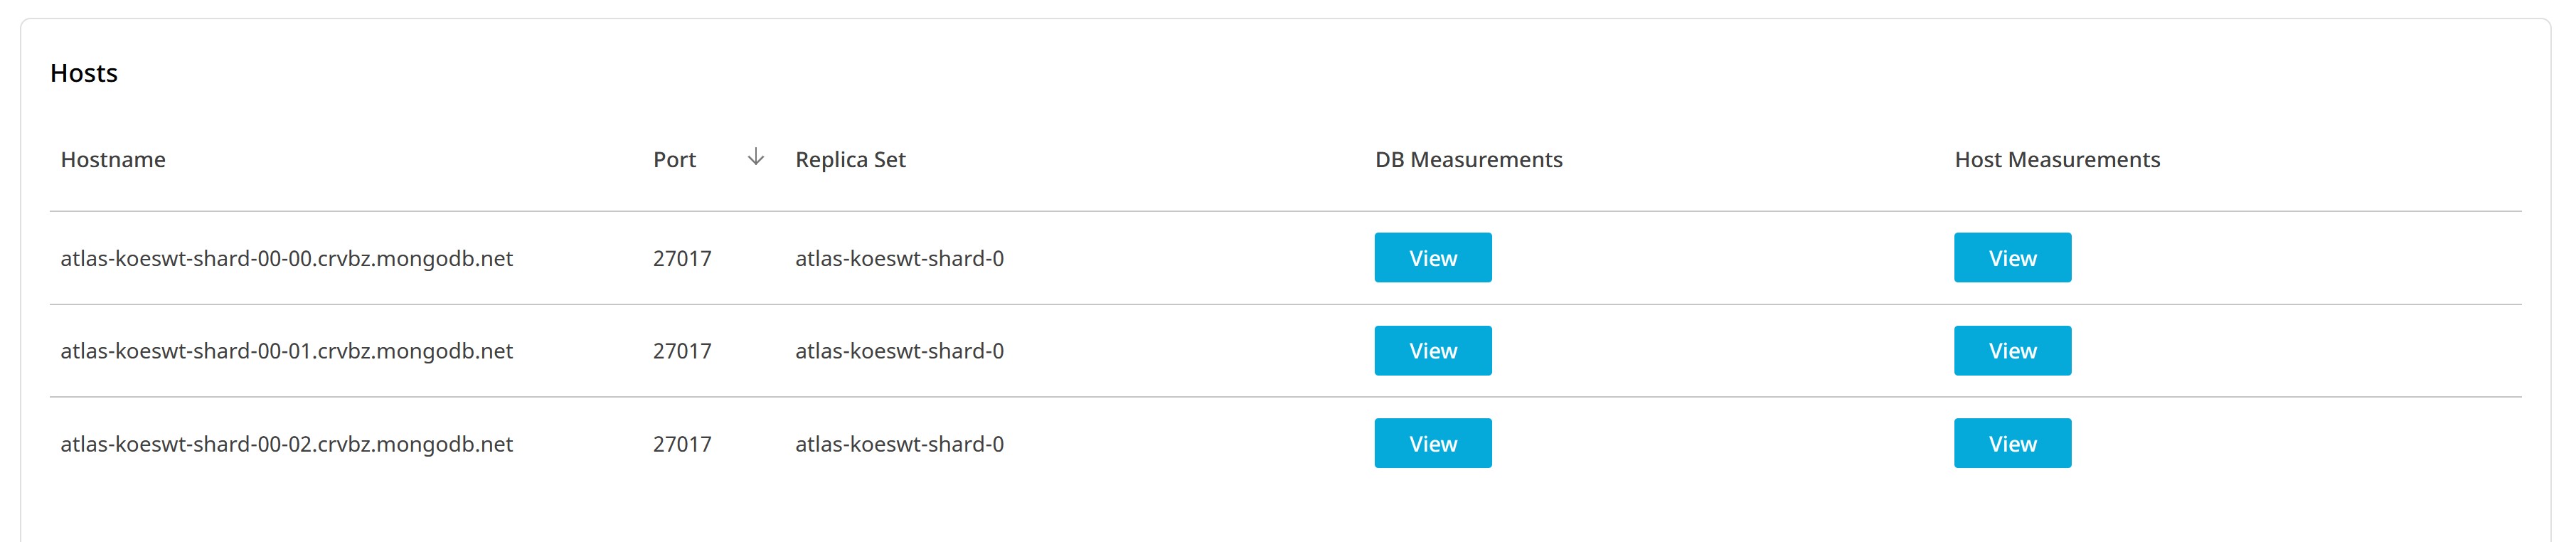
Clusters
To view this dashboard click Atlas MongoDB in the left navigation pane. The Organizations dashboard gets displayed. Click Clusters from the top menu. The Clusters dashboard displays all Atlas clusters in the current organization. You can select a cluster to view the relevant details of the cluster.
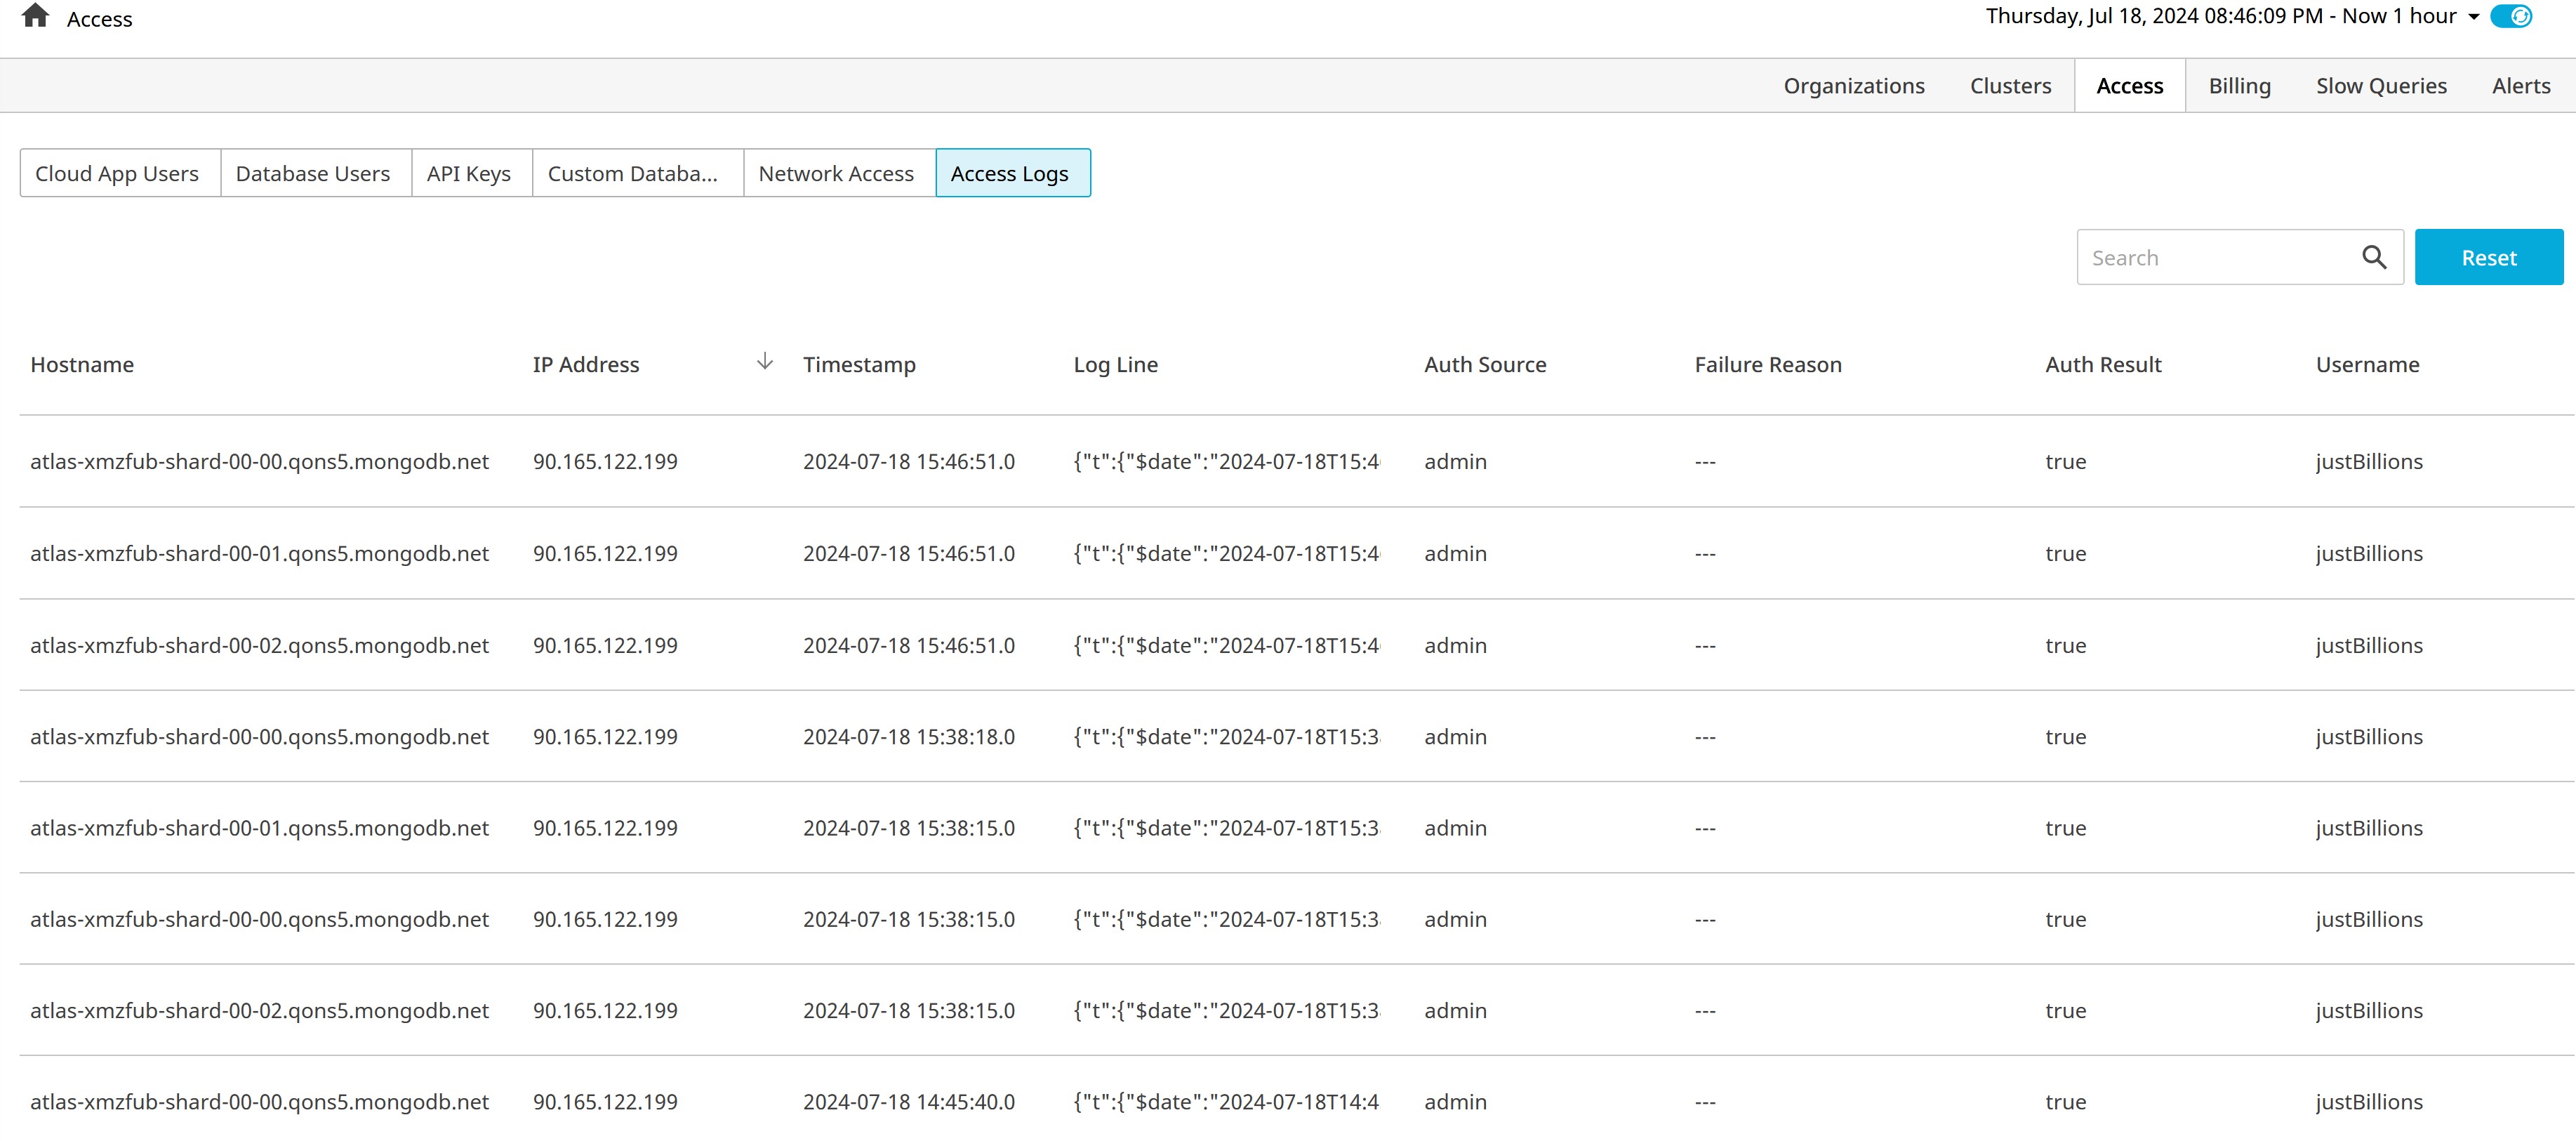
Access
To view the Access dashboard click Atlas MongoDB in the left navigation pane. The Organizations dashboard gets displayed. Click Access from the top menu. The Access dashboard has six subpages:
- Cloud App Users- Displays Atlas users created on the organization, their roles, and teams
- Database Users- Displays all database users in the organization, along with their database access roles
- API Keys- Displays all organization or project programmatic access keys, their roles, and the IP ranges they may be used from.
- Custom Database Roles- Displays the database roles that Atlas users have created for the organization
- Network Access- Displays the address ranges from which database users may connect
- Access Logs- Displays the authentication attempts along with their statuses
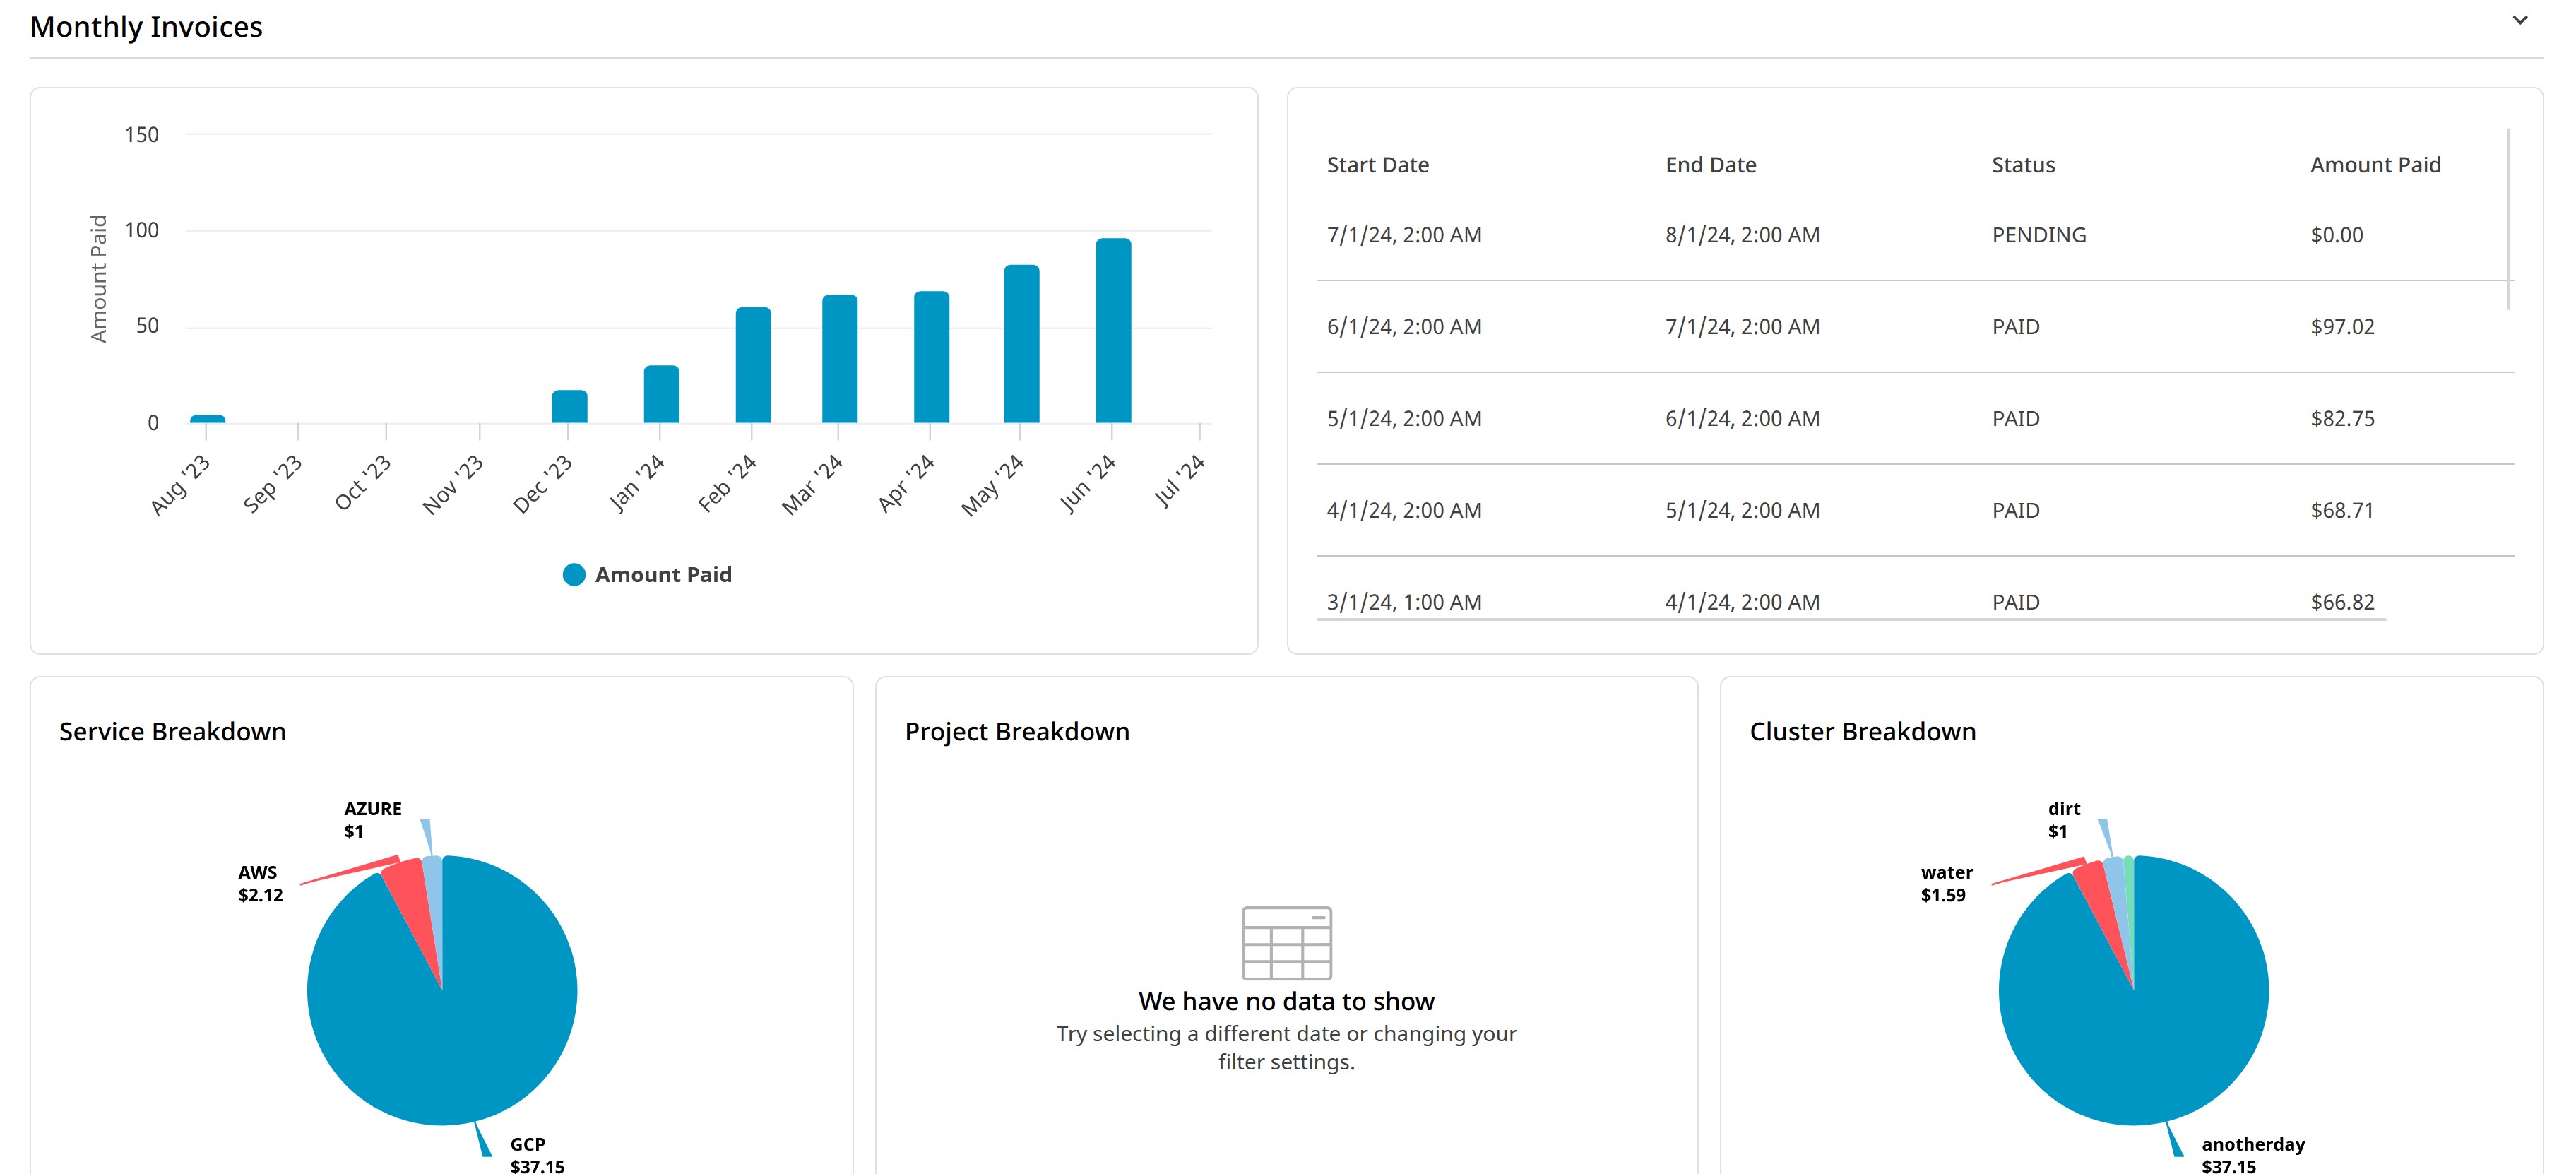
Billing
To view the Billing dashboard click Atlas MongoDB in the left navigation pane. The Organizations dashboard gets displayed. Click Billing from the top menu. This dashboard displays a horizontally split view, with monthly invoices in the top section and details for a selected invoice in the bottom section. It shows the last year of monthly invoices in both chart and table formats. Total payments are broken down by service, project, and cluster. The individual invoice details include a chart of daily costs, along with refunds, payments, and the current total for pending invoices. Similar to the previous year’s breakdown, the invoice detail provides the selected month’s costs broken down by service, project, and cluster.
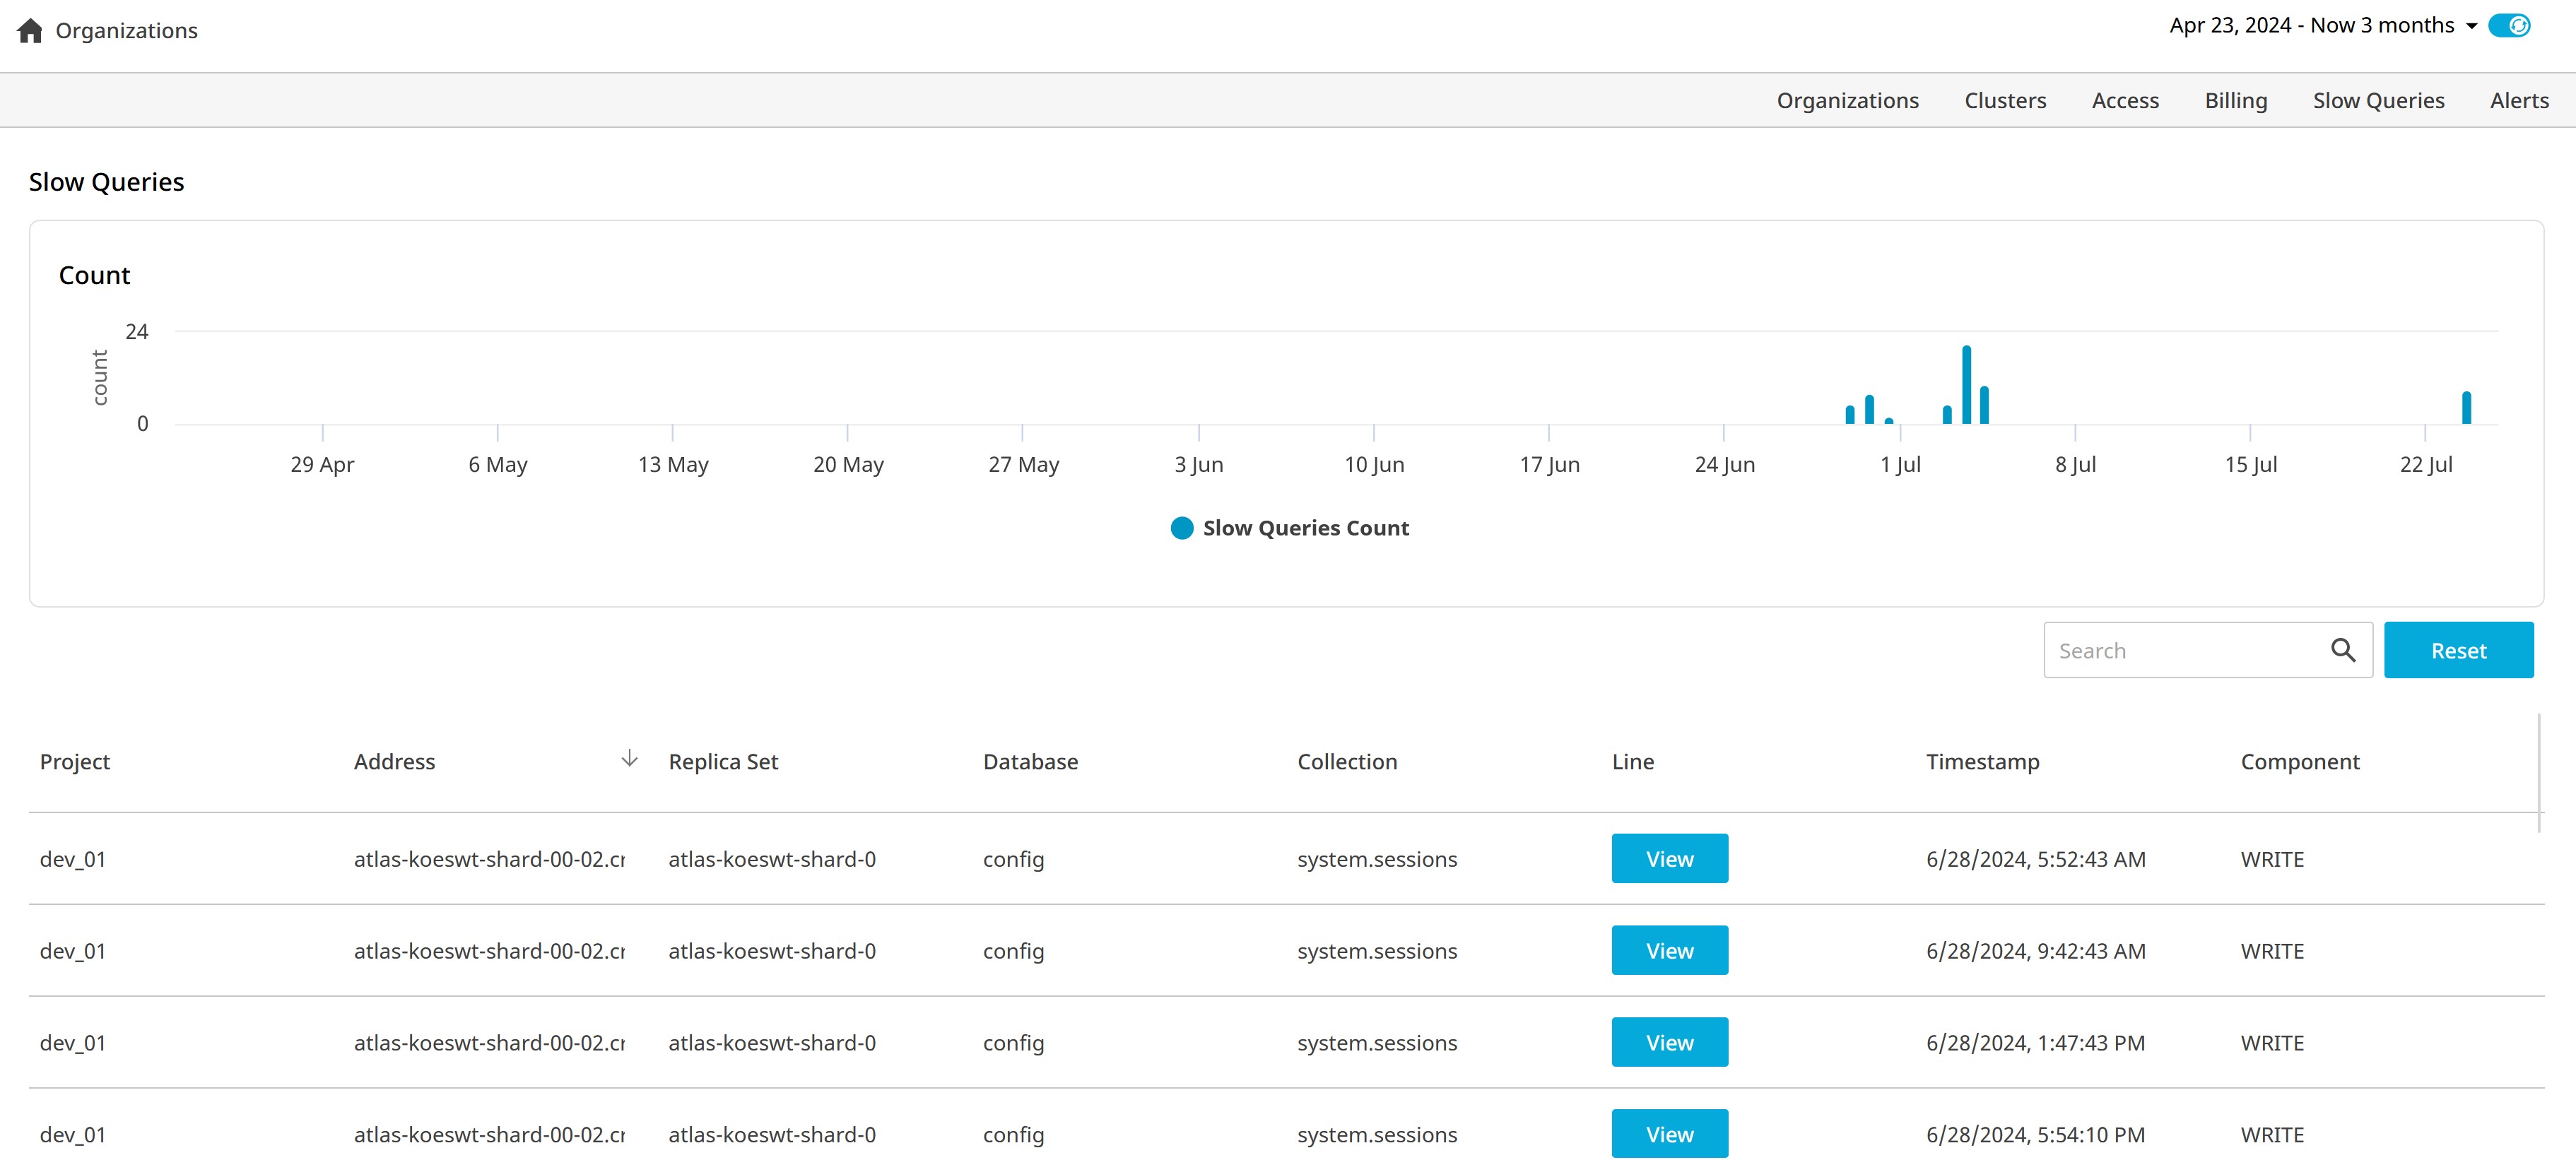
Slow Queries
To view this dashboard click Atlas MongoDB in the left navigation pane. The Organizations dashboard gets displayed. Click Slow Queries from the top menu. The Slow Queries dashboard displays a bar chart showing when slow queries occurred and provides a table with detailed information about individual queries.
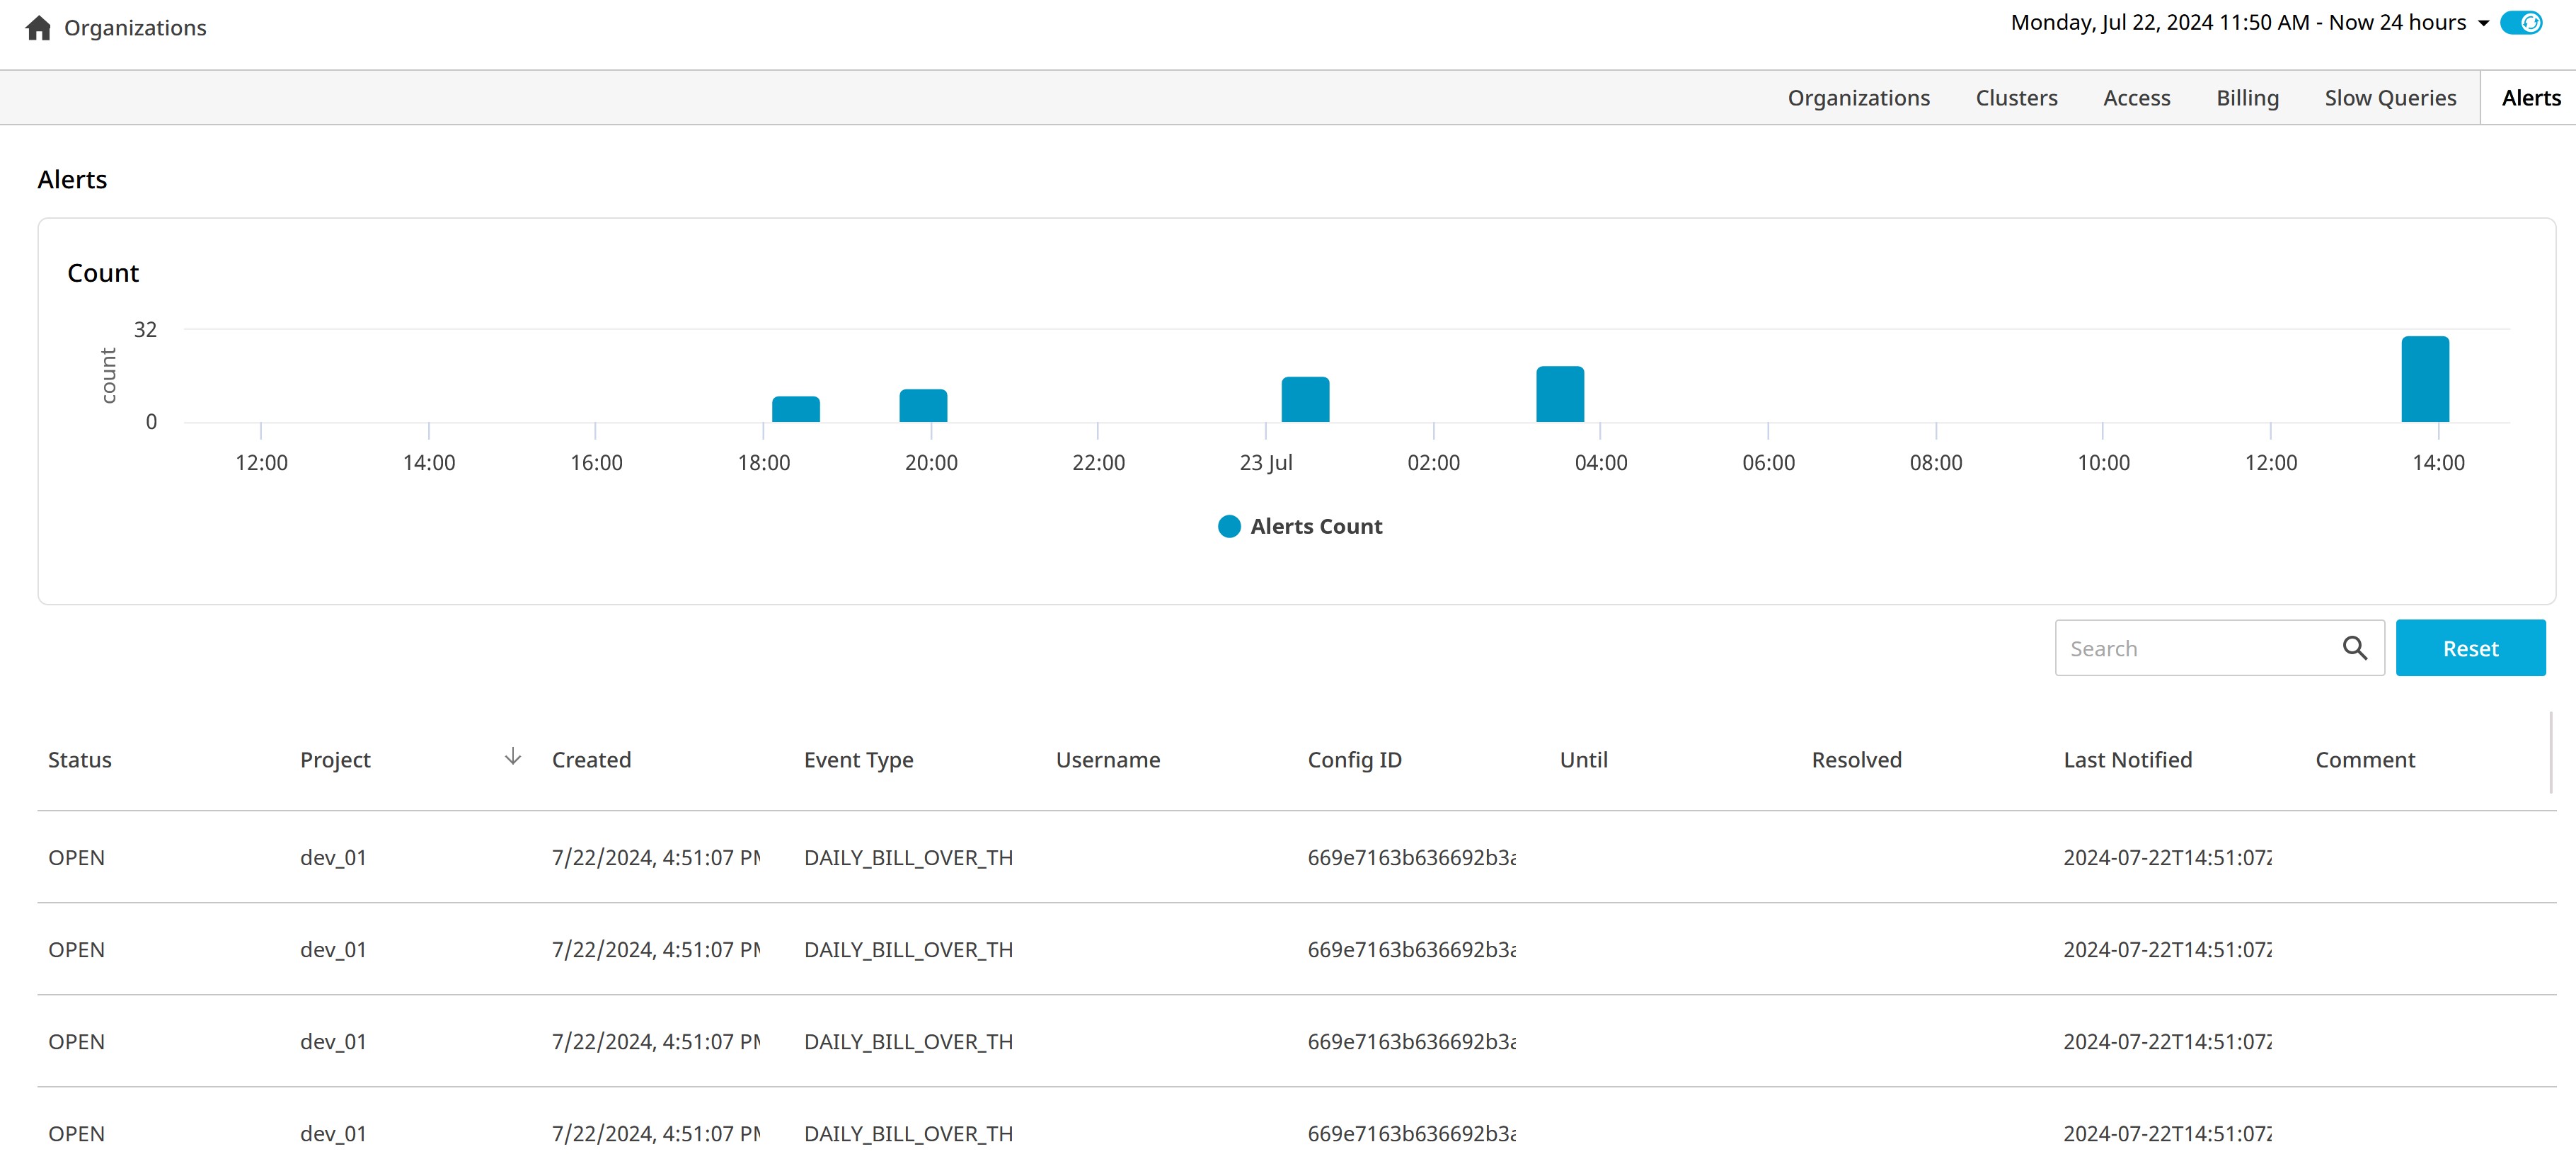
Alerts
To view the Alerts dashboard click Atlas MongoDB in the left navigation pane. The Organizations dashboard gets displayed. Click Alerts from the top menu. This dashboard displays a bar chart of when project-level alerts occurred and lists detailed information about individual alerts in a table. The Atlas Administration API limits this dashboard to project-level alerts and does not support monitoring organization-level alerts.