Welcome to Foglight cloud
Welcome to Foglight page serves as the initial dashboard that greets you upon logging into Foglight. Designed to enhance user experience, the Welcome page presents a list of typical tasks, granting quick access to frequently used dashboards. By clicking on a specific task link, the corresponding dashboard associated with the selected task is presented in the display area.
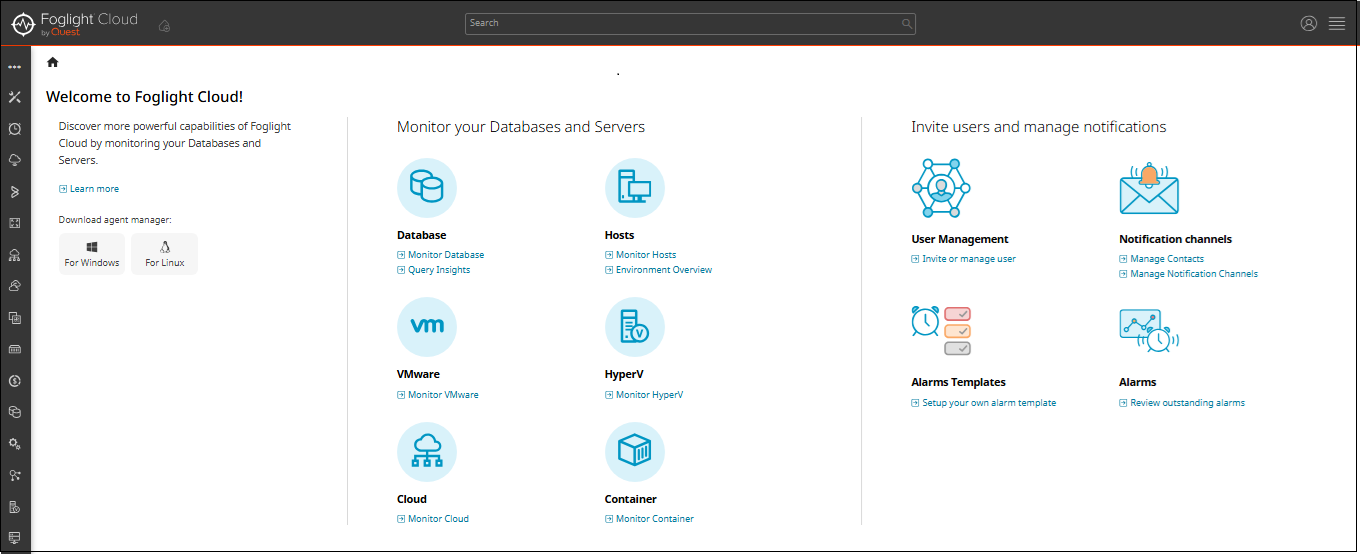
Most dashboards that you can reach from this page can also be accessed from the navigation panel. The collection of dashboards that you can access from the Welcome page depends on the roles associated with your user account. For example, users with the Cloud Administrator role have access to a wider range of dashboards than the users with the Cloud User role. The differentiation in dashboard availability based on user roles ensures that individuals have appropriate access and visibility aligned with their assigned responsibilities within the Foglight environment.
To initiate monitoring of your environment, the first step is to download and install an Agent Manager. If, upon logging in, you notice an orange notification displayed at the top of the Welcome page, it indicates the need to add an FglAM before proceeding further. To add an FglAM, click Go to Agent Managers. For more information about Agent Managers, refer to Installing Foglight Agent Manager.
You have the ability to monitor and assess the performance of various components within your environment. This section allows you to monitor the following:
Databases
To monitor all the databases, click Monitor Database. The Databases page provides an at-a-glance view of the monitored environment, with all of the currently monitored database types. A color-coded bar, provides a visual representation of the summarized health condition of all instances listed in the Database Group table.
Hosts
To monitor all hosts, click Monitor Hosts. You can monitor hosts using workflows that are displayed on the Hosts dashboard. By following these workflows, you can view the performance of all monitored hosts or drill down on a single host. The Host dashboard page provides a high-level summary of host state and performance, including alarms, CPU, memory, disk, and network utilization.
VMware
To monitor all virtual centers, click Monitor VMware. You can view reports, alarms, FAQs, and summary of all the virtual centers.
Hyper-V
To monitor all the Hyper-V clusters, click Monitor Hyper-V. You can view the reports, alarms, FAQs, and the summary of all the Hyper-V clusters.
Cloud
To monitor cloud infrastructure for Azure, AWS or Google, click Monitor Cloud. Foglight Hybrid Cloud Manager simplifies the cloud performance and cost monitoring process, allowing you to view Azure, AWS, and Google Cloud inside a single platform.