Working with Time Range
This section provides information about the time range which is displayed at the top of a dashboard. It indicates the current time range for all the views on the page:
The default current time range setting is the last 1 hour. You can override this setting by choosing another interval in the User Preferences page. For more information, refer to User Preferences.
This section covers the following key areas:
Changing the time range in a dashboard normally affects all the views in the dashboard. If an individual view in a dashboard has a different time range, that takes precedence over the time range for the dashboard.
Viewing the Calendar
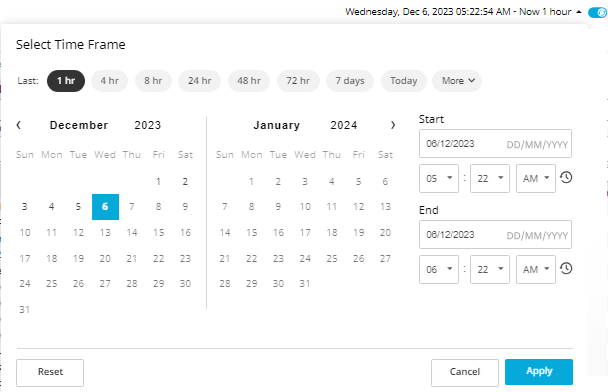
Use the calendar option to set a historical time period by specifying the start and end date and time, defining the range you want to span. Click the time range to access the calendar, which allows you to specify a new time range.
To adjust the time range using the calendar options:
- Click on the time range which is displayed at the top of a dashboard. You can select the time range setting as required. For example, last one hour, four hours, or more.
- Specify the start and end date, and select a time. You can select the dates from the calendar or enter the dates in the Start and End fields.
The start time cannot be later than the current time.
- Click Apply. The dashboard view is updated based on the new time range.
Some dashboards do not support the calendar feature. They only display the current time. For example, the Agent Managers Dashboard.
Freezing a Time Range
By default, the time range in a dashboard is displayed in real time. You can tell this at-a-glance if the word Now appears in the time range display.
You can freeze the time range so that the data which Foglight displays in the views reflects a certain interval. When the time range is freezed, the views do not display new data. It displays only the historical data.
Freezing the time range helps you diagnose problems that occurred during a specific interval.
To freeze a time range:
- Navigate to the dashboard for which you want to freeze the time range.
- Follow the steps mentioned in Viewing the Calendar section. The time range is freezed and displays the historical data. If you later refresh a dashboard, you may notice that the time range remains fixed.
You can switch OFF the auto refresh toggle to freeze the current time.
Some dashboards do not support historical data. For example, Databases Dashboard.
To unfreeze a time range, click the  icon.
The time range changes to end at the last monitoring time range that you used (for example, the last four hours).

