Viewing Alarms
This section, covers the following key areas:
Filtering the Alarm List
You can filter the list according to different criteria by clicking in the top-left corner of the list and changing the settings in the Alarm Filter dialog box.
For example, you can filter the list of alarms to show only Current or Historical alarms. Select Current to shows all outstanding alarms. This is essentially the current outstanding set of alarms that need to be addressed. Use Current if you want to see what is immediately noteworthy. In contrast to Current, Historical shows all alarms that fired during a certain interval, regardless of whether they are active or cleared.
Use Historical if you want to see what is happening in your monitored environment during a specific time range.
In the Alarm Filter dialog box, you can also set a number of other parameters to help you filter the list, and you can set the maximum number of results to display in the table.
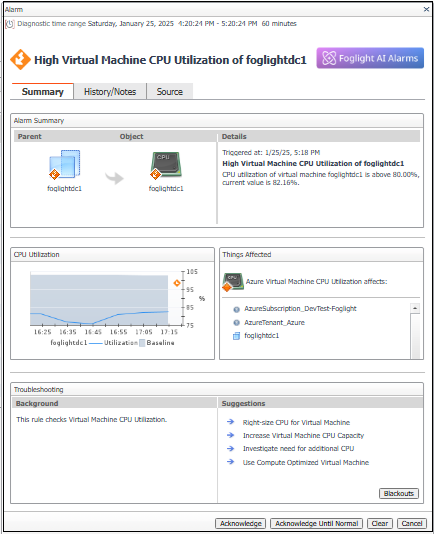
Viewing Alarm Details
To view details about an alarm, click its severity icon in the Alarm(s) list. Information about that alarm is displayed in the Alarm Details dialog box. Depending on how a rule is set up, the Alarms Details view varies.
This dialog box shows the alarm’s service level impact and its full history. The history includes all consecutive alarms fired by the same rule on the same object (instance) regardless of the dashboard’s time range.
In addition, this dialog box displays a diagnostics and a recommended action message to assist you in resolving the problem. Click one of the provided links to display a drilldown page that will assist you in diagnosing the problem.
For example, if an alarm is fired because the credentials were not established when trying to connect to a host machine, drilldown links to credential details are provided. Click the Diagnostics link to display the Credentials Query dialog box. From there, you can configure the credential query that triggered the alarm.
Click the Recommended Action link to display the Manage Credential dashboard. From there you can map each credential to one or more resources, choosing the parameters and patterning criteria that best suit your needs.
You can also drill down from this dialog box to investigate the severity of the alarm in more detail. For example, click the icon in the Service Level Impact table for information about the service whose Service Level Agreement is affected by the alarm. Performing impact analysis on an alarm helps you to determine the priority of the problem that caused the alarm to fire.
Investigating the Alarm Source
In the Alarms table, the Instance field lists the object in your monitored environment that is the source of the alarm. Click the listing for an alarm source to display its health summary. The health summary shows the number of alarms by severity and the health of the alarm source and lists the agents and host associated with the alarm source.
In addition, it provides a list of related views that show quick drilldowns to help identify the root cause. This list is based on the views that match the type of the alarm source. If no related views are available, then the default views (for example, Configuration > Data browser) are provided.
Adding Alarm Notes
Using alarm notes is a handy way to record information about an alarm for other users to view. For example, if an urgent alarm comes up that you want to investigate, you can add a note to the alarm that you are checking if a certain process is causing the problem. The note is attached to the alarm along with your user name and a timestamp.
You can view, filter, add, and edit alarm notes from the Alarm Details dialog box. Use the History tab to attach notes to a particular alarm in the history table. Use the All Notes tab to attach a note to the most recent alarm in the alarm history.
Using AI Alarms
Foglight AI Alarms feature is an advanced functionality that enhances troubleshooting efficiency.
Key Benefits
- Enhanced alarm insights: AI integration delivers detailed information about each alarm, that helps you to understand the underlying issue.
- Root cause analysis: The feature suggests potential causes of the alarm, saving time on initial investigation efforts.
- Guided troubleshooting: Foglight provides actionable suggestions, guiding users through deeper investigation paths within the platform.
- Resolution recommendations: You will receive AI-driven recommendations for corrective actions, accelerating issue resolution and minimizing downtime.
To use the AI Alarms feature, you need a license. To generate a license, refer to Generating a License.
To use AI Alarms:
Navigate to Alarm Management > Alarms in the left pane. The Alarms page displays the list of all alarms.
On the Alarms page, click on the Alarm Message column of the required alarm from the list. The Alarm dialog box appears and displays the alarm details.
You can access this Alarm dialog box from any location where the alarm list appears.
Click Foglight AI Alarms. The Foglight AI Alarms Sign in screen appears.
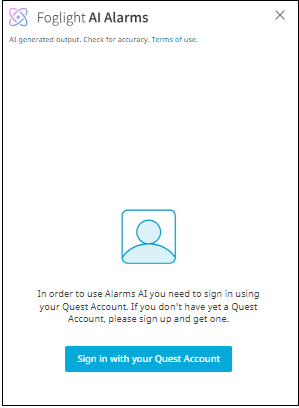
To use AI Alarms, you must sign in with your Quest Account. If you do not have a Quest Account yet, sign up to create one.
Click Sign in with your Quest Account.
If you do not have a license, then the status displayed is disabled. Click Contact Sales to request a license.
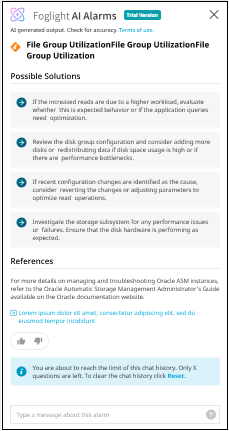
If your license exists but the feature is not enabled, an error message will be displayed. For more information refer to the Troubleshooting section.The Foglight AI Alarms screen displays the alarm details for the selected alarm.
You can collapse or restore the AI Alarms screen as needed. When you collapse the AI Alarms screen, the query results are automatically saved for future reference. To view the saved results, click the  icon.
icon.
This screen displays details such as problem summary, possible causes, troubleshooting, and reference. You can type your query about the required alarm in the message field. You will receive AI-powered suggestions for corrective measures, enabling faster issue resolution. You can interact with the chat to ask follow-up questions or request more details about the information provided.
You can click on the response icons to provide your feedback.
If you encounter any errors, refer to the Troubleshooting section.